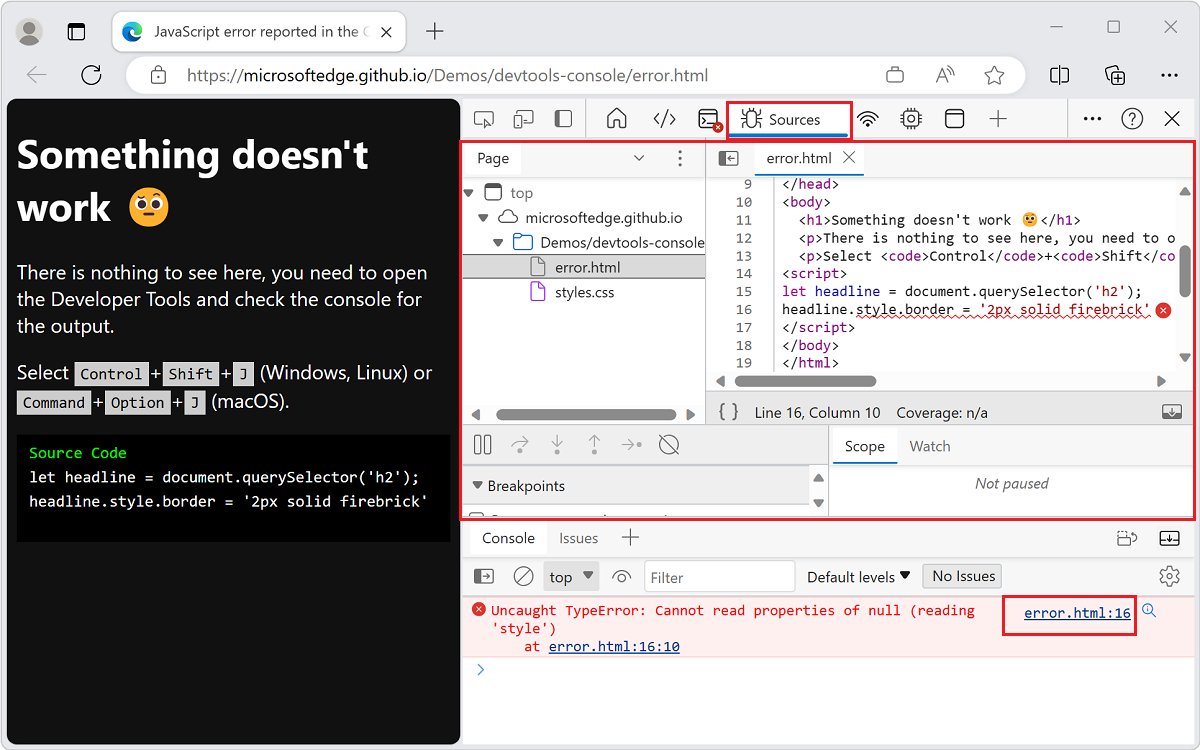
Press Ctrl + Shift + J in Microsoft Edge to open the Console, read the red error, and click the file:line link beside it to jump to the failing code in the Sources tool.
This guide covers what each error type means, how to pause and inspect the code with breakpoints, how to trace failed network requests, and how to confirm the fix before you ship it.
The fastest way to find a JavaScript error in Edge
The Console is the default place where Edge reports JavaScript and connectivity errors. Every error carries a link to the exact file and line that threw it.
- Open the page that misbehaves in Microsoft Edge.
- Press Ctrl + Shift + J on Windows or Linux, or Command + Option + J on macOS. DevTools opens on the Console tool.
- Reload the page so errors thrown during loading are captured.
- Read the red error message. The first word, such as
TypeErrororReferenceError, tells you the kind of failure. - Click the link on the right of the message, for example error.html:16. The Sources tool opens with the failing line highlighted.
- Compare the highlighted line with what the message says is missing or wrong, then fix it in your source code.
Most errors end here. When the line looks correct but the values are wrong, pause the code with a breakpoint, as described further down.
Which DevTools tool fits your error?
| What you see | Open this tool | Why |
|---|---|---|
| A red error message and a broken feature | Console | Shows the error type, the message and a link to the line that threw it |
| The code runs but produces the wrong result | Sources with a breakpoint | Pauses the code so you can read every variable at that moment |
Failed to load resource or a status such as 404 |
Network | Shows the request URL, status code, headers and response body |
| Warnings about accessibility, compatibility or security | Issues | Groups problems by category with a description and a suggested fix |
| The page is slow or stutters rather than failing | Performance | Records runtime activity; with source maps it shows your original function names |
| An error message you do not understand | Explain this error (Copilot in Edge) | Opens an explanation of that exact message in the Edge sidebar |
Understanding JavaScript Errors
Every JavaScript error is an object based on Error, with a name (the type) and a message (the detail). Together they tell you where to start looking.
| Error type | Example message | What it usually means |
|---|---|---|
SyntaxError |
Uncaught SyntaxError: Identifier 'technologies' has already been declared |
The code cannot be parsed or breaks a language rule, so the script never runs |
ReferenceError |
"x" is not defined |
A variable or function name is used before it exists or is out of scope |
TypeError |
Uncaught (in promise) TypeError: data.forEach is not a function |
A value is not the type the code expects, often because an earlier step returned nothing useful |
RangeError |
invalid array length |
A number is outside the range a function accepts |
| Network error | Failed to load resource: the server responded with a status of 404 () |
A file or API call failed; the JavaScript that depends on it fails next |
Uncaught (in promise) prefix |
Any error thrown inside an async call with no catch |
A promise rejected and nothing handled it |
Chain reactions are common. In Microsoft's own demo, a 404 on an API request is followed by data.forEach is not a function, because the code received an error page instead of an array. Fix the first error in the list first.
Opening Microsoft Edge DevTools
Which tool DevTools opens on depends on how you open it. Pick the route that lands you where you want to work.
| Action | Tool that opens |
|---|---|
| Press Ctrl + Shift + J (Windows, Linux) or Command + Option + J (macOS) | Console |
| Press F12 or Ctrl + Shift + I (Windows, Linux) or Command + Option + I (macOS) | The last tool you used, or the Welcome tool |
| Right-click any item on the page and select Inspect | Elements, with that item selected in the DOM tree |
| Select Settings and more (…) > More tools > Developer tools | The last tool you used, or the Welcome tool |
| Press Ctrl + Shift + C (Windows, Linux) or Command + Option + C (macOS) | Elements, with the <body> element selected |
If F12 does nothing, go to edge://settings/system, scroll to Developer Tools, and turn on Use F12 key to open the Developer tools. With DevTools already open, press Esc to show the Console in the lower Quick View panel under any other tool.
The Console: Your First Stop for Errors
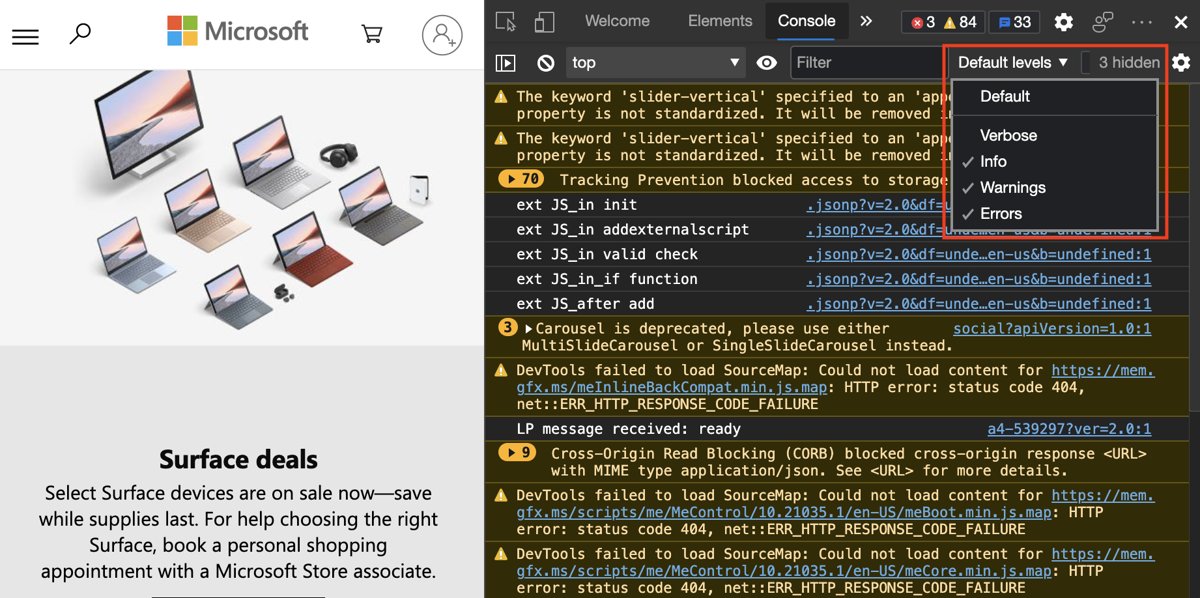
A busy page can fill the Console with warnings and log lines from other developers. Filter it down to errors before reading anything.
- Press Ctrl + Shift + J to open the Console.
- Click the Log Levels dropdown and clear Warnings, Info and Verbose so only Errors remain.
- Type part of the message into the Filter box to narrow the list further. A regular expression such as
/^Uncaught/also works. - Click the Show console sidebar button and select Errors to see how many errors each script source produced.
- Click the magnifying-glass Search for this message on the Web button to look the exact message up in a new tab.
- Click the file:line link on the right of the message to open the failing line in Sources.
The Console also runs JavaScript. Type an expression and press Enter to test a theory, or press Shift + Enter to write several lines before running them.
Explain an error with Copilot in Edge
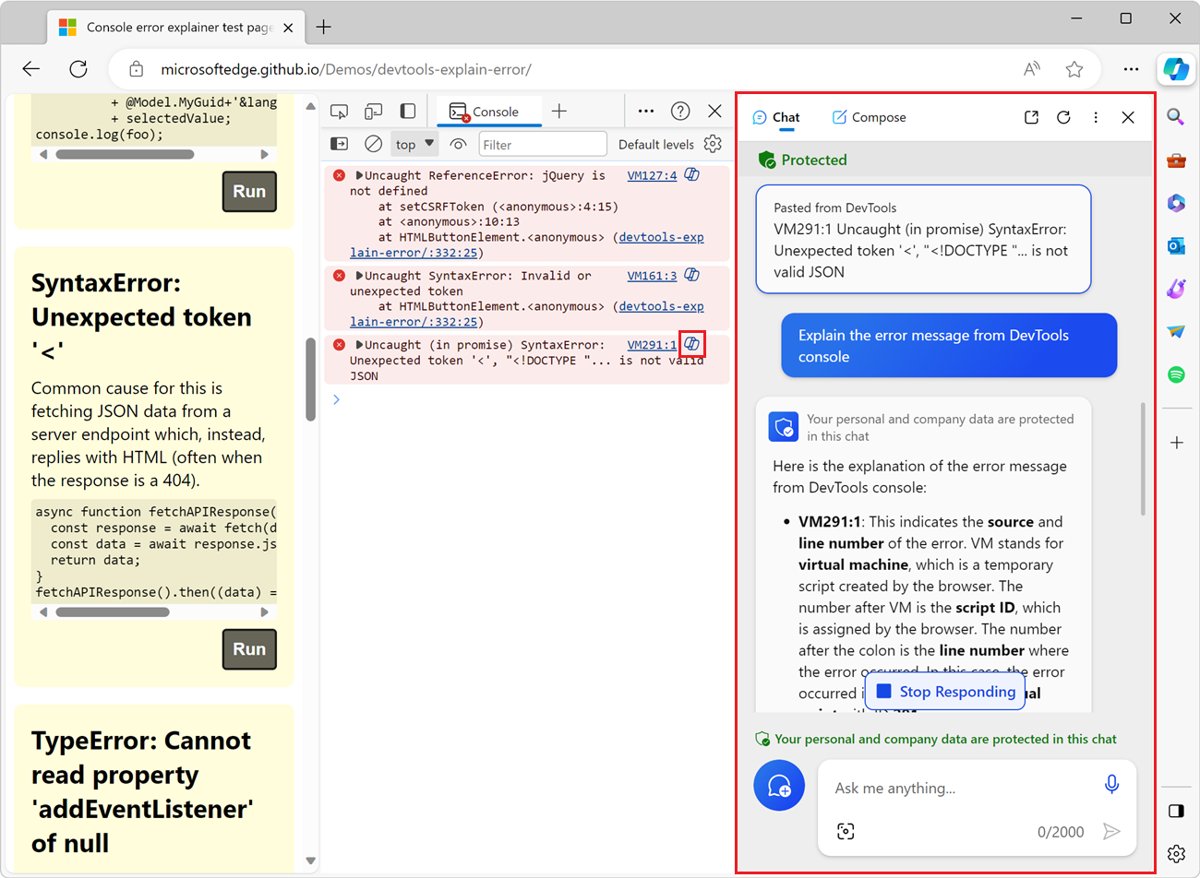
The Console can hand an error message to Copilot in the Edge sidebar. The feature does not work in an InPrivate window, Kids Mode, a WebView2 app or a standalone PWA window.
- Sign in to Microsoft Edge with your account.
- Check that the Copilot icon shows in the top-right of the toolbar. If not, go to Settings and more (…) > Settings > Sidebar > Copilot and turn on Show Copilot.
- Open the page with the error and press Ctrl + Shift + J.
- Click the Explain this error button next to the error message in the Console.
- Read the explanation in the sidebar, and type follow-up questions there if you need more detail.
Copilot answers are generated automatically and can be wrong. Treat them as a lead, then confirm the cause with a breakpoint.
Using the Sources Panel
The Sources tool is the code editor and JavaScript debugger. It has three parts: the Navigator pane listing every file the page loaded, the Editor pane, and the Debugger pane.
- Press Ctrl + Shift + I and select Sources on the Activity Bar.
- In the Navigator pane, open the Page tab and select the JavaScript file you want to read.
- If the file is minified onto one line, click the Format button at the bottom of the Editor pane to pretty-print it.
- Click the line number of the suspect line to set a breakpoint. A red marker appears beside it.
- Reproduce the bug on the page. DevTools pauses before that line runs.
- Read the Scope pane for the local, closure and global variables and their current values.
- Click Resume script execution to let the code continue to the next breakpoint.
The Call Stack in the Debugger pane lists the functions that led to the paused line. Click any entry to see the code that called it.
Using Debugging Features
A line-of-code breakpoint only helps when you know where to look. The other breakpoint types find the line for you.
| You want to pause… | Breakpoint to use | How to set it |
|---|---|---|
| On the line that throws an error | Exception | In the Breakpoints pane, select Pause on uncaught exceptions; add Pause on caught exceptions for errors inside try...catch |
| On one exact line | Line-of-code | Click the line number in Sources, or add a debugger; statement to your code |
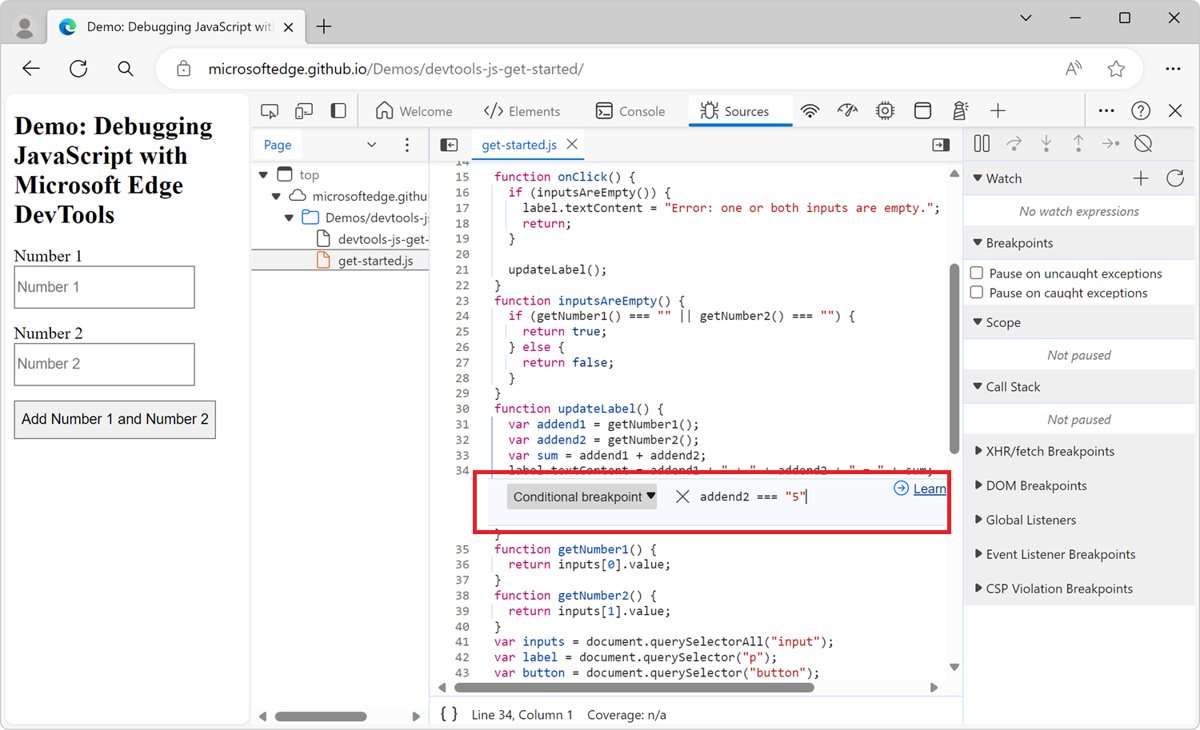
| On a line, but only when a value is wrong | Conditional | Right-click the line number, select Add conditional breakpoint, type the condition and press Enter |
| When a button or key is used | Event listener | Expand Event Listener Breakpoints, then select a category such as Mouse or a single event such as click |
| When the page requests a certain URL | XHR/fetch | Expand XHR/fetch Breakpoints, click Add breakpoint and enter part of the URL |
| When code changes or removes an element | DOM change | In Elements, right-click the element, select Break on and pick subtree modifications, attribute modifications or node removal |
| Whenever a function runs | Function | Run debug(functionName) in the Console while the function is in scope |
| Never, but log a value | Logpoint | Right-click the line number, select Add logpoint and enter a message or expression |
Once paused, use Step over to run a function call without entering it, Step into to follow it, and Step out to finish the current function. Right-click a line and select Continue to here to skip ahead. Add a Watch expression such as typeof sum to track a value while you step.
Network Issues
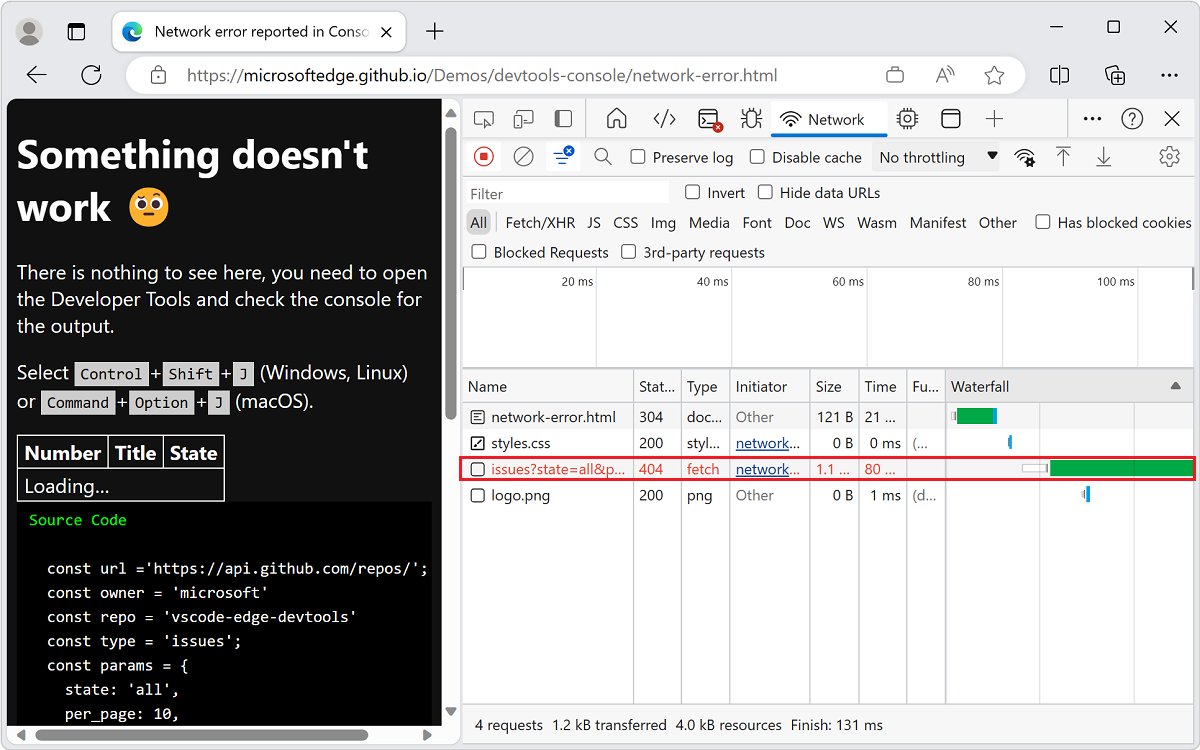
When a request fails, the JavaScript waiting for its data fails too. Trace the request before touching the code that consumes it.
- In the Console, find the network error that starts with an HTTP method such as
GETfollowed by a URL. - Click that URL. The Network tool opens on the failed request.
- Read the Status column. A 404 means the server could not find the requested URL.
- Select the request and open the Headers panel to compare the requested URL with the one you meant to call.
- Open Response or Preview to see what the server actually returned, such as an HTML error page instead of JSON.
- Click the link in the Initiator column to jump to the line of code that sent the request.
- Fix the URL or the error handling, then reload with Empty cache and hard refresh from the right-click menu of the Refresh button.
The Network tool only records activity after it opens, so reload the page with DevTools open. In Microsoft's demo, the bug was a doubled slash in the API URL caused by a trailing slash on the base address.
Accessibility Tools
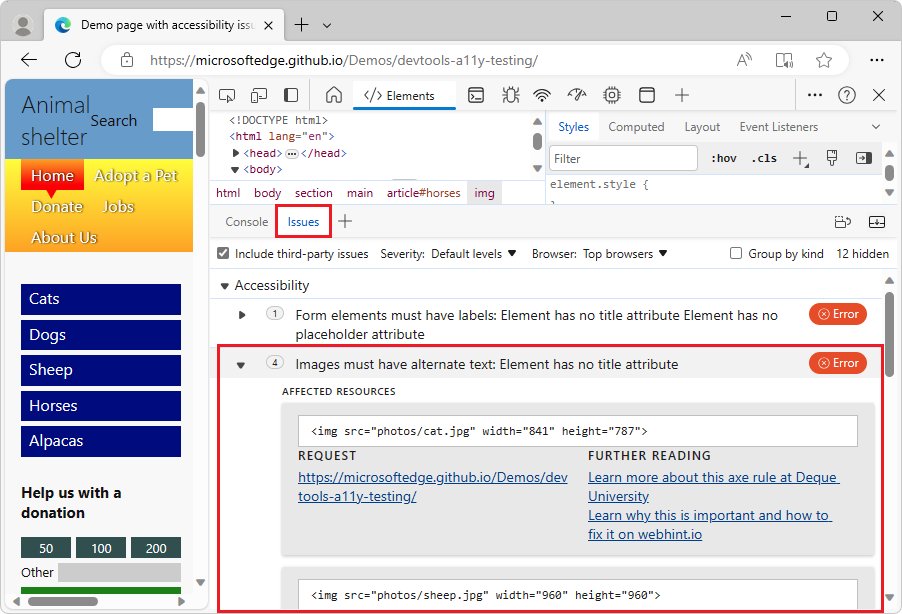
The Issues tool analyzes the page and lists problems that do not always raise a Console error. Categories include accessibility, compatibility across browsers, performance, Progressive Web Apps and security.
- Open DevTools and press Esc if the Quick View panel at the bottom is hidden.
- Select the Issues tab in the Quick View toolbar. If it is missing, click More tools (+) and select Issues.
- Click an issue to expand its description and suggested fix.
- Under AFFECTED RESOURCES, click the tool name in the Open in link to see the element, file or request involved.
- Use the Severity dropdown to add Tips or Info, and select Include third-party issues to see problems from libraries.
In the Elements tool, a wavy underline under an element name marks an issue. Right-click the element and select View issues to jump straight to it.
Debug your original code with source maps
Minified or compiled code produces errors on line 1 of an unreadable file. Source maps let DevTools show your original files, line numbers and function names while Edge still runs the minified code.
- Make your build tool emit source maps. TypeScript, Babel, Webpack, Rollup, Vite and Parcel can all produce them.
- Check that the compiled file ends with a
//# sourceMappingURL=comment pointing at the.mapfile. - In DevTools, click Customize and control DevTools (…) > Settings > Preferences.
- Under Sources, confirm Enable JavaScript source maps is selected. It is on by default.
- Close Settings and reload the page. Console links and the Call Stack now open your original files.
DevTools does not load source maps from file:// paths on another device by default. The Allow DevTools to load resources, such as source maps, from remote file paths option under Sources changes that, and it is off for security reasons.
Cleaning Up Your Code
Fixing one error is half the job. Code that catches and reports its own failures makes the next error faster to find and kinder to users.
- Wrap code that can fail, such as parsing or network calls, in
try...catch. Thecatchblock runs only if thetryblock throws. - Put clean-up that must always run in a
finallyblock, which runs whether or not an error was thrown. - Check
response.okafter everyfetchandthrowanErrorwith the status code when it is false. - Show the user a message in the page when data fails to load, instead of leaving a spinner that never ends.
- Log the technical detail with
console.error()so it shows in the Console as an Error-level message. - Use
console.assert(condition, message)to log an error only when an assumption is false, andconsole.trace()to print how a function was reached. - Remove leftover
debugger;statements and temporaryconsole.log()calls before you deploy.
How to check the fix worked
DevTools lets you test a fix on the live page before you change the real file.
- While paused on a breakpoint, type the corrected expression in the Console and press Enter. Microsoft's demo prints
6forparseInt(addend1) + parseInt(addend2). - Click Resume script execution, then edit the line in the Editor pane of Sources.
- Press Ctrl + S (Windows, Linux) or Command + S (macOS). Edge loads the edited script and the change takes effect immediately.
- Click Deactivate breakpoints so the page runs without pausing, then repeat the action that failed.
- Confirm the feature works and no new red messages appear in the Console.
- Copy the change into your real source file and deploy it. Edits made in DevTools are temporary and are lost on reload.
- Reload with Empty cache and hard refresh and check that the Console stays clear.
Troubleshooting JavaScript Errors in Microsoft Edge DevTools
You keep getting JavaScript errors, or the debugger pauses in code you do not recognize
A browser extension injects its own scripts and event listeners into every page you visit.
- Open the same page in an InPrivate window, which disables extensions.
- Check whether the error still appears. If it does not, an extension is the source.
- In DevTools, click Settings and open the Ignore List page.
- Select Add content scripts to ignore list so stepping skips extension code.
- Turn extensions off one at a time in normal browsing to find the one responsible.
How to fix a JavaScript error on a site you do not own
The fault is in the site's code or in a stale cached copy of it; only the site owner can change the code.
- Open DevTools and reload with Empty cache and hard refresh from the right-click menu of Refresh.
- Try the page in an InPrivate window to rule out extensions and stored site data.
- If the error remains, copy the exact message and the file:line reference from the Console.
- Send both to the site owner, since the error is in their code.
The error points to line 1 of a minified file
The page runs bundled code and DevTools has no source map to translate it.
- Click Format at the bottom of the Editor pane to pretty-print the file.
- Set a breakpoint on the formatted line and reproduce the error.
- For your own site, publish source maps and confirm Enable JavaScript source maps is on in Settings > Preferences.
The Console is too noisy to find the real error
Warnings, info messages and third-party logs bury the one error that matters.
- Use the Log Levels dropdown to show only Errors.
- Open the console sidebar and select Errors, then expand it to filter by source file.
- Read the earliest error first; later errors are often knock-on failures.
The Console shows no error, but the feature still fails
The code runs without throwing but produces a wrong value, or a try...catch swallows the error.
- In Sources, select Pause on caught exceptions in the Breakpoints pane.
- Set an Event Listener Breakpoint for the event that starts the feature, such as click.
- Step through the code and watch values in the Scope and Watch panes until one is wrong.
If the whole Edge tab freezes rather than throwing an error, see Microsoft Edge is showing Result_Code_Hung Error Code to Some.
External Resources and Tools
- Fix JavaScript errors reported in the Console — Microsoft's six demo pages covering script, network and created errors
- Get started debugging JavaScript — Step-by-step breakpoint tutorial on a buggy demo page
- Pause code with breakpoints — Every breakpoint type and when to use it
- JavaScript error reference (MDN) — One page per error message, with causes and fixes
- Find and fix problems using the Issues tool — Accessibility, compatibility and security checks
Frequently Asked Questions
What is a JavaScript error?
A JavaScript error is an object the browser creates when code cannot run as written. It has a name, such as TypeError or ReferenceError, and a message describing the problem. Edge reports it in the DevTools Console with a link to the line that caused it.
How do I fix a JavaScript error?
Open the Console with Ctrl + Shift + J, click the file and line link next to the error, and read the highlighted code. If the cause is not obvious, set a breakpoint there, reproduce the bug and inspect the variable values in the Scope pane.
How do I troubleshoot JavaScript that fails without an error?
Set a breakpoint where the feature starts, such as an Event Listener Breakpoint on click, then step through the code. Watch the Scope and Watch panes until a value differs from what you expect. Turn on Pause on caught exceptions in case a try…catch hides the error.
How do I handle errors in JavaScript?
Wrap code that can fail in try…catch, so the catch block runs when the try block throws. For fetch calls, check response.ok and throw an Error when it is false. Show users a readable message and log the detail with console.error().
Why do I keep getting JavaScript errors?
Repeated errors on many sites usually come from a browser extension that injects scripts into every page. Open the page in an InPrivate window, which disables extensions. If the errors stop, turn extensions off one at a time to find the cause.
How do I fix a JavaScript error on Windows?
JavaScript errors come from web page code, not from Windows itself. In Edge, reload the page with Empty cache and hard refresh while DevTools is open, then test it in an InPrivate window. If the error remains, the site owner has to fix it.
What does 'Uncaught (in promise)' mean?
It means an asynchronous operation, such as a fetch request, rejected and no catch handler dealt with it. Check the Network tool for a failed request first, then add a catch block or try…catch around the await so the failure is handled.
Can I edit JavaScript directly in Edge DevTools?
Yes. Open the file in the Sources tool, edit it in the Editor pane and press Ctrl + S. Edge runs the change immediately, but it is temporary. Copy the fix into your real source file and redeploy it to keep it.
How do I see errors from minified JavaScript as my original code?
Publish source maps with your build and make sure the compiled file has a sourceMappingURL comment. Enable JavaScript source maps is on by default in DevTools Settings > Preferences, and Console links then open your original files.
Conclusion
Start every JavaScript fault in the Console with only Errors showing, fix the earliest error first, and switch to a breakpoint in Sources as soon as the failing line looks correct. The first error is often the cause of every later one, and a paused debugger shows the real values that a message alone cannot.

![How to Download and Install Language Pack in Windows 11/10 [Guide]](https://techdows.com/wp-content/uploads/2026/09/Windows-10-Language-settings-page-with-Add-a-language-button.jpg)
![How to Install/Add Microsoft Print to PDF Printer on Windows 11/10 [Tutorial]](https://techdows.com/wp-content/uploads/2026/09/Turn-Windows-features-on-or-off-dialog-with-a-scrollable-checkbox-list-600x338.jpg)