A HAR file (HTTP Archive) is a JSON log of every network request a browser made while a page loaded, and you generate one from the Network panel of Chrome, Edge or Firefox developer tools.
This guide covers what a HAR file contains, how to capture one in each browser for a support ticket, how to open and read it, and how to keep passwords and cookies out of it.
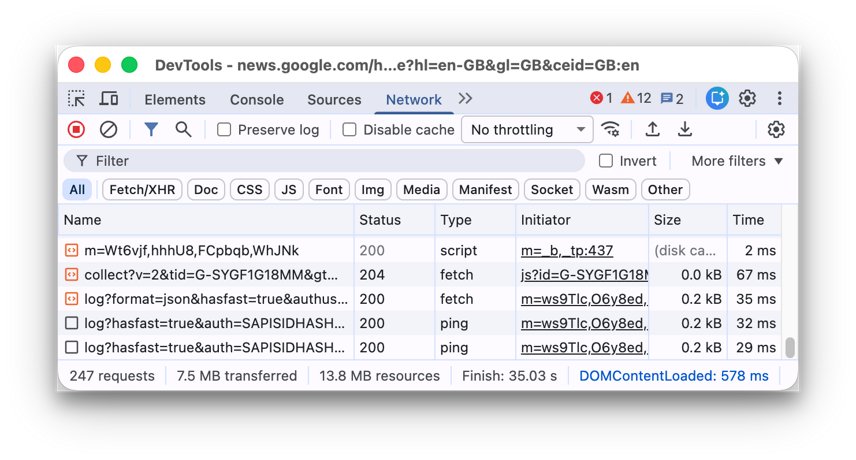
How do I generate a HAR file for troubleshooting browser issues?
These steps work in Google Chrome and Microsoft Edge on Windows and Mac. Close other tabs first so the log only holds the problem page.
- Open the page that has the problem.
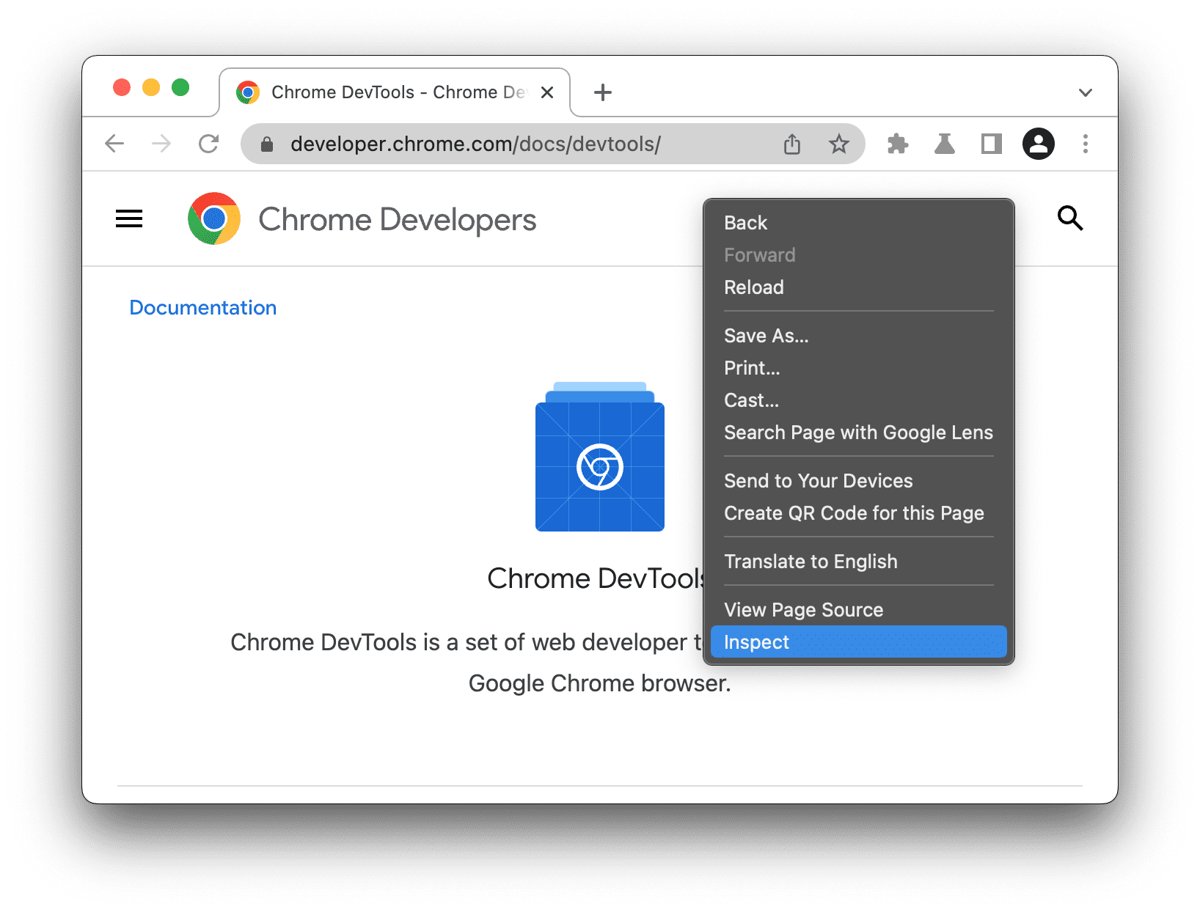
- Right-click anywhere on the page and select Inspect, or press F12.
- Select the Network tab in the developer tools panel.
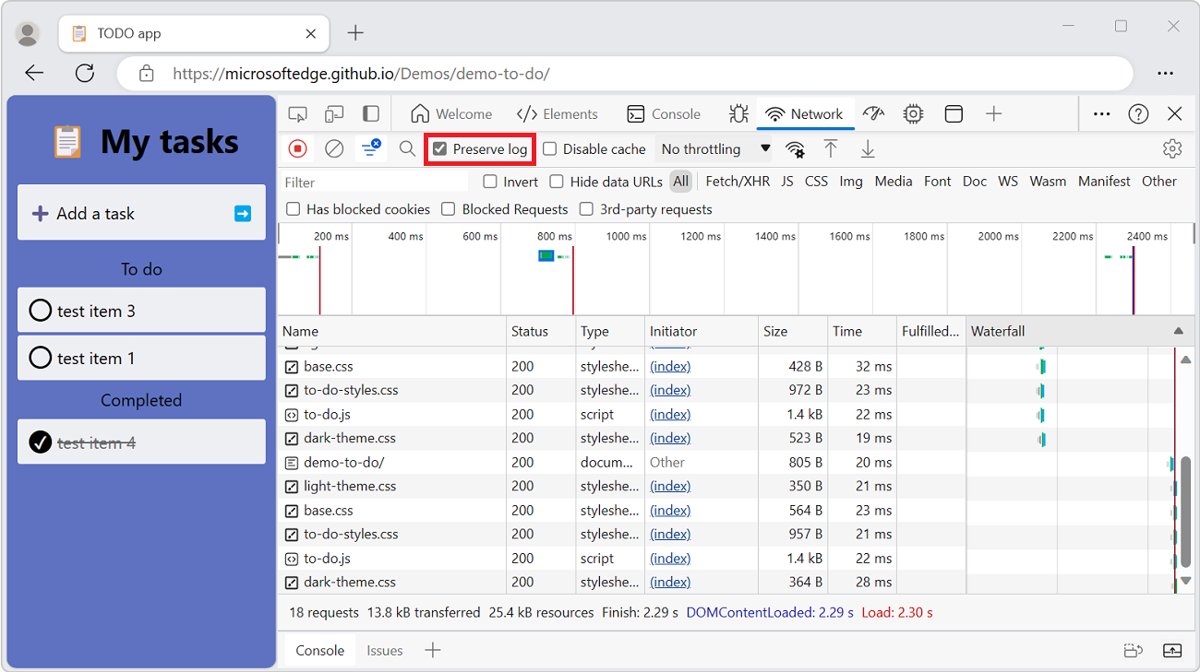
- Tick Preserve log so the log is not cleared when the page reloads or redirects.
- Reload the page and repeat the action that fails, then wait a few seconds after the error appears.
- Select the Export HAR (sanitized) button in the action bar at the top of the Network panel.
- Give the file a descriptive name, save it, and attach the .har file to your support ticket.
What is a HAR file?
HAR stands for HTTP Archive. Browser developer tools and other HTTP session tools use it to export captured network traffic, and the file itself is a JSON object with a fixed set of fields.
| Question | Answer |
|---|---|
| HAR file full form | HTTP Archive |
| File extension | .har |
| Format | Plain-text JSON, readable in any text editor |
| What it records | Each request's URL, method, status code, request and response headers, timing and, in a full export, cookies and authorization headers |
| Who asks for it | Website, SaaS and ad-platform support teams who need to see why a page fails to load, sign-in loops, or requests time out |
| What creates it | The Network panel in Chrome, Edge and Firefox developer tools |
| What opens it | Browser developer tools, Google's HAR Analyzer, or a text editor |
Generate HAR file on Google Chrome browser
Chrome exports a sanitized HAR by default, which leaves out the Cookie, Set-Cookie and Authorization headers.
- Press Ctrl + Shift + I on Windows or Cmd + Option + I on a Mac to open Chrome DevTools.
- Select the Network panel.
- Tick Preserve log, and tick Disable cache if the problem only happens on a first visit.
- Reload the page and reproduce the problem.
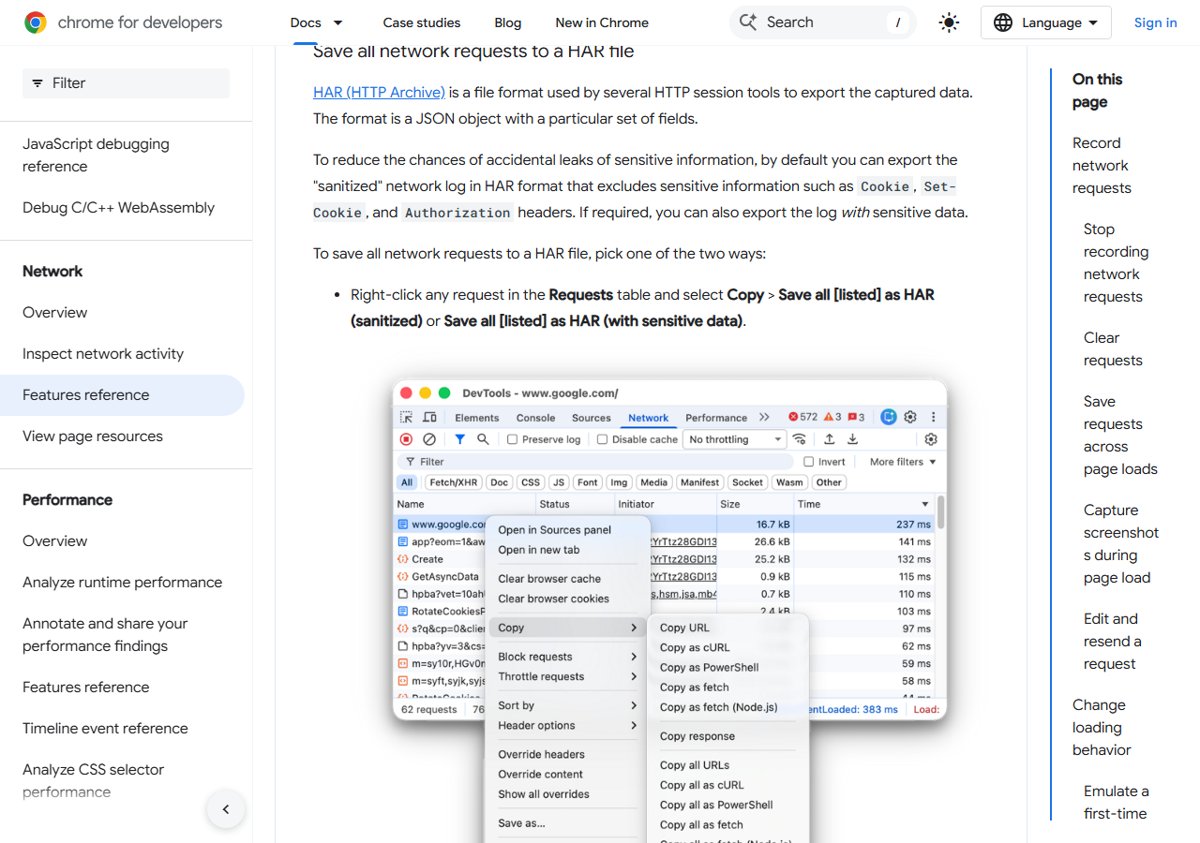
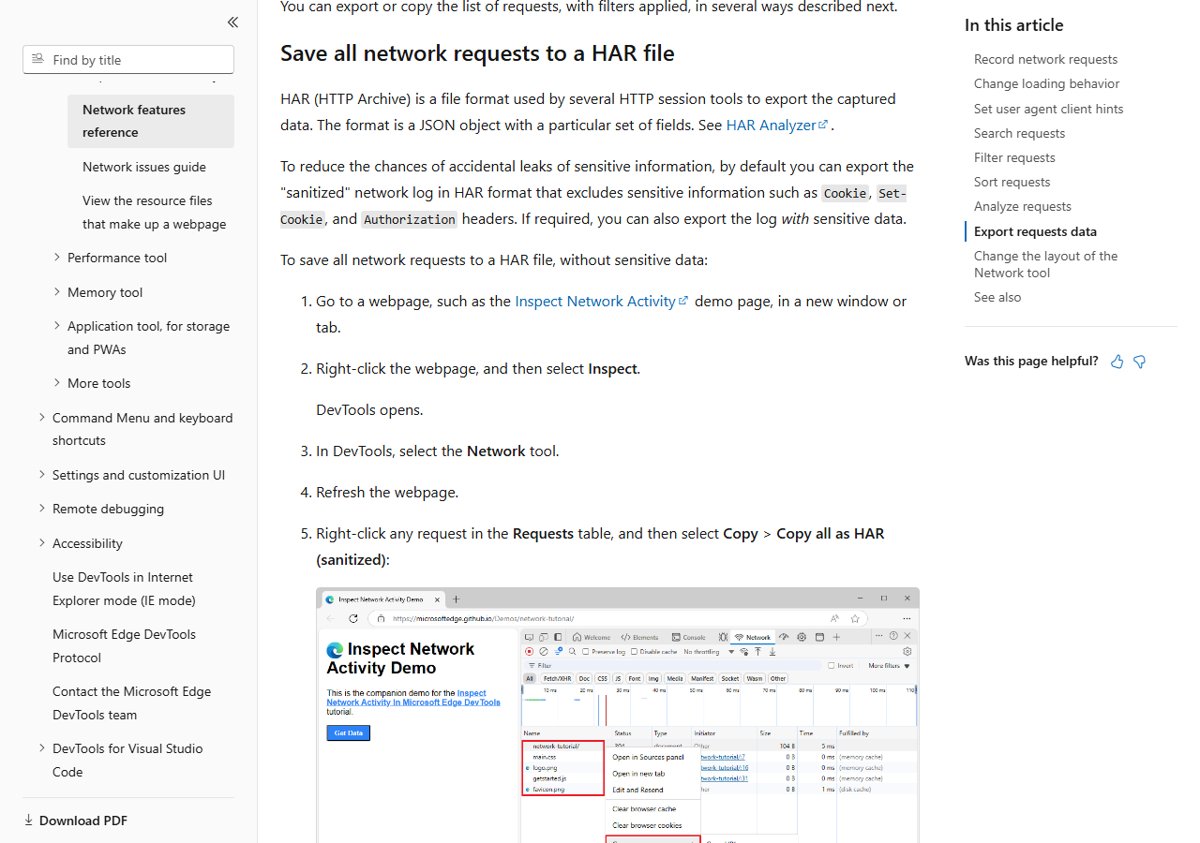
- Right-click any request in the Requests table and select Save all as HAR (sanitized), or select Export HAR (sanitized) in the action bar.
- Choose a folder and save the .har file.
Press Ctrl + E (Windows) or Cmd + E (Mac) with the Network panel focused to stop recording once the problem has been captured.
Export HAR file from Microsoft Edge
Edge uses the same DevTools engine as Chrome, the tools you also use to troubleshoot JavaScript errors in Edge. Its export includes every request since DevTools opened; you cannot filter the export or save a single request.
- Open the page in Edge, right-click it and select Inspect.
- Select the Network tool and tick Preserve log.
- Refresh the page and reproduce the problem.
- Select the Export HAR (sanitized) button in the action bar at the top of the Network tool.
- Save the file, or right-click a request and select Copy > Copy all as HAR (sanitized) to paste the log into a ticket instead.
How to generate HAR file on Firefox?
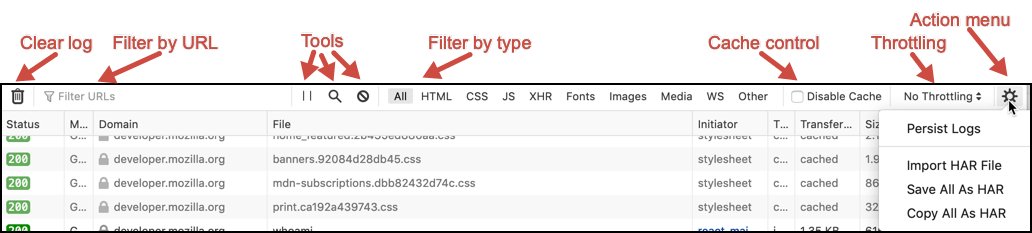
Firefox calls its Network panel the Network Monitor. It clears the log on every page load unless Persist Logs is on.
- Press Ctrl + Shift + E on Windows or Linux, or Cmd + Opt + E on a Mac, to open the Network Monitor.
- Open the menu of other actions on the Network Monitor toolbar and turn on Persist Logs.
- Reload the page and reproduce the problem.
- Open the same menu and select Save All as HAR.
- Choose a folder in the file dialog and save the .har file.
Copy All as HAR in the same menu puts the log on the clipboard in HAR format instead of saving a file.
How to open HAR files?
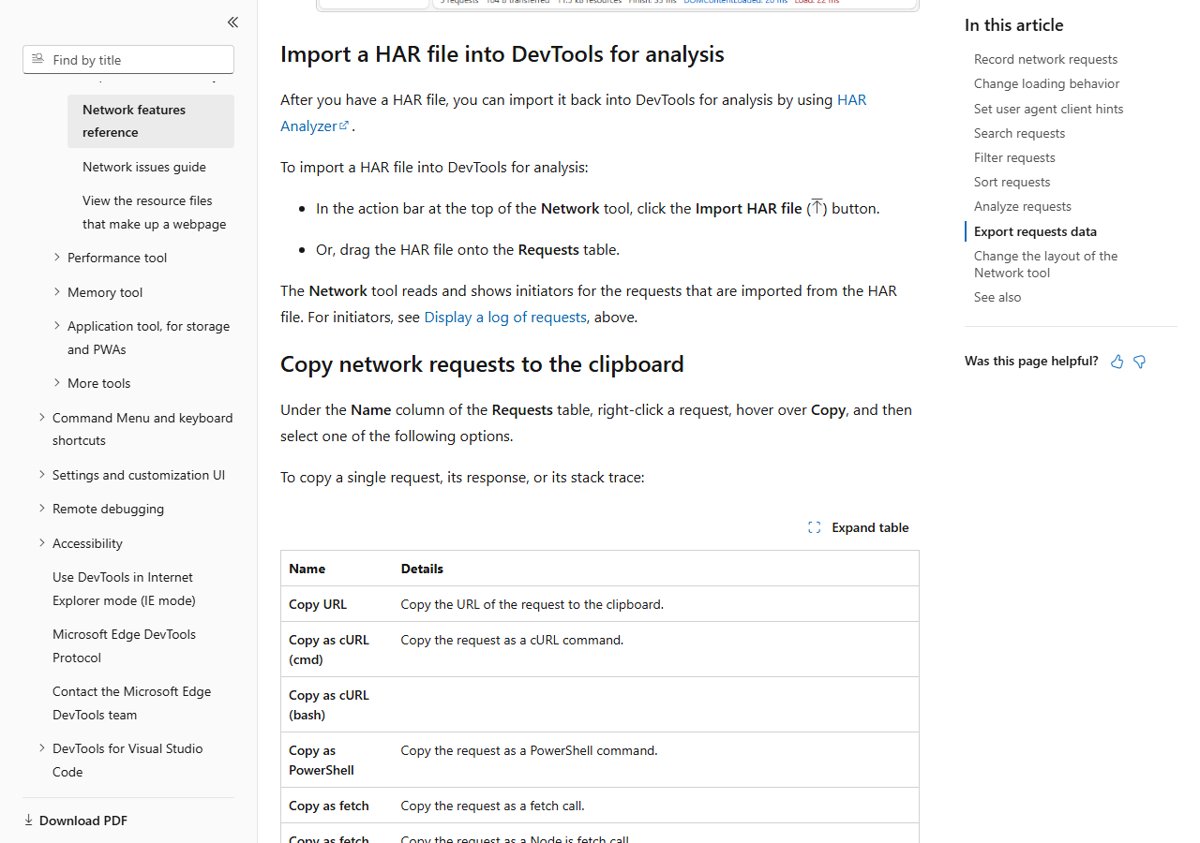
Importing a HAR file into DevTools shows the requests exactly as they looked in the browser that captured them, with timings and initiators.
- Open Chrome or Edge and press F12 to open DevTools on any tab.
- Select the Network panel.
- Drag the .har file onto the Requests table, or select the Import HAR button in the action bar.
- Select a request to see its headers, response and timing.
- In Firefox, open the Network Monitor, then select Import HAR from the menu of other actions.
What software is used to view HAR files?
| Your situation | Use this | Why |
|---|---|---|
| You want to replay requests with timings | Chrome or Edge DevTools Import HAR | Shows the waterfall, headers and initiators like a live capture |
| You use Firefox | Firefox Network Monitor Import HAR | Built in, no extra software |
| You need a HAR file analyzer that flags errors | Google HAR Analyzer at toolbox.googleapps.com | Reads the file in the browser with no DevTools knowledge needed; Microsoft's Edge DevTools docs point to it |
| You only need to search for a URL or error text | Notepad, VS Code or another text editor | A HAR file is plain JSON, so Find works on it |
| You want to remove a header before sharing | A text editor | Delete the value in the JSON and save the file |
Is it safe to share a HAR file?
A full HAR export can contain session cookies and authorization tokens, which let someone act as you on that site until the session expires.
Share the sanitized export unless the support team specifically asks for sensitive data, and send it only through the vendor's own ticket system. Chrome and Edge only offer Export HAR (with sensitive data) after you tick Allow to generate HAR with sensitive data under Settings > Preferences > Network, so the default file already strips the Cookie, Set-Cookie and Authorization headers.
Firefox's Save All as HAR writes the full log, so sign out of the site after you share it to end the captured session.
Check the HAR file captured the problem
- Import the saved file back into the DevTools Network panel.
- Confirm the request list starts before the failing action and includes the page that showed the error.
- Look for requests with a red status, such as 4xx or 5xx codes, or a failed status.
- Open the file in a text editor and search for the page URL to confirm the request is in the log.
- If the list is empty or stops early, capture again with Preserve log or Persist Logs turned on.
HAR file problems and fixes
The HAR file is empty or missing the failed request
DevTools only records while it is open, and the log clears on reload without Preserve log.
- Open DevTools before you load the page.
- Tick Preserve log in Chrome or Edge, or turn on Persist Logs in Firefox.
- Reproduce the problem and export again.
Export HAR (with sensitive data) is missing
Chrome and Edge hide the full export until a setting allows it.
- Open DevTools Settings and go to Preferences > Network.
- Tick Allow to generate HAR with sensitive data.
- Close settings and use the export button's drop-down to pick Export HAR (with sensitive data).
Double-clicking the .har file does nothing
Windows has no default app for .har files.
- Right-click the file and select Open with.
- Pick Notepad to read the raw JSON.
- For a readable request list, import it into the DevTools Network panel instead.
The problem only appears on a first visit
Cached files hide the requests that fail on a clean load.
- Tick Disable cache on the Network panel.
- Keep DevTools open, reload the page and export the HAR file.
HAR file FAQ
What is the HAR file full form?
HAR stands for HTTP Archive. It is a JSON-formatted file that records the network requests a browser made, including URLs, headers, status codes and timings, so a support team can see why a page failed.
How do I capture a HAR file in Edge?
Right-click the page and select Inspect, open the Network tool, tick Preserve log, refresh and reproduce the problem. Then select Export HAR (sanitized) in the action bar and save the file.
Can I open a HAR file in Edge?
Yes. Open Edge DevTools with F12, select the Network tool, and drag the .har file onto the Requests table or select the Import HAR file button. The requests appear with their headers and timings.
Where does Edge save a HAR file?
Edge saves the HAR file wherever you choose. After you select Export HAR (sanitized), pick the folder and file name in the save prompt, then attach that file to your ticket.
What is a HAR file analyzer?
A HAR file analyzer is a tool that reads the HAR JSON and shows the requests in a readable list. Google's HAR Analyzer at toolbox.googleapps.com runs in the browser, and Chrome, Edge and Firefox DevTools can import HAR files too.
What is the best HAR file viewer or reader?
The DevTools Network panel in Chrome, Edge or Firefox is the most complete viewer, because it shows the request waterfall and headers. A text editor such as Notepad works for searching the raw JSON.
Does a HAR file contain my password?
A sanitized export from Chrome or Edge leaves out the Cookie, Set-Cookie and Authorization headers. A full export can include session cookies and tokens, so share it only with the support team that asked for it.
Can I save a single request as a HAR file?
No. Edge's documentation states that the export saves all requests since DevTools opened, and you cannot filter requests or save a single one. Clear the log before you reproduce the problem to keep the file small.
Why is my HAR file empty?
DevTools was opened after the page loaded, or the log cleared on reload. Open DevTools first, turn on Preserve log or Persist Logs, reproduce the problem and export again.