To use Sysinternals Process Explorer, run procexp.exe as administrator, read the process tree in the top pane, and switch the lower pane between DLL view and handle view to see what each process has loaded or opened.
This tutorial covers the window layout, finding which process holds a file, adding columns, tracing a high CPU thread, checking a suspicious process, the System Information graphs and replacing Task Manager.
How to use Sysinternals Process Explorer
These steps take you from a closed tool to a full view of one process. Every later section builds on this routine.
- Right-click
procexp.exeand select Run as administrator, so Process Explorer can read details of system processes and other users' processes. - Accept the Sysinternals license terms the first time the tool starts.
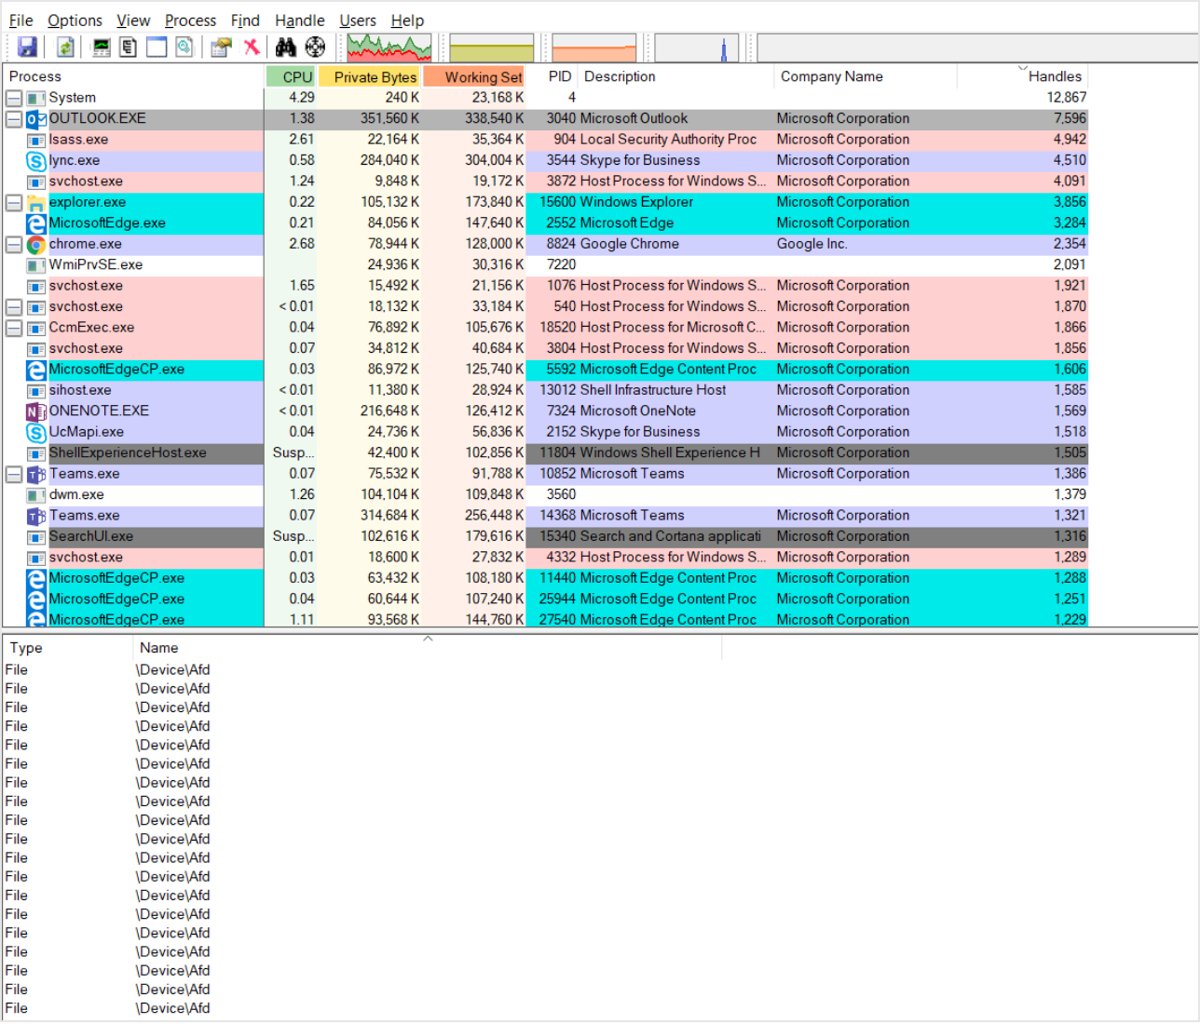
- Look at the top pane: every running process appears in a tree under the process that started it, with its owning account.
- Select a process, then open the View menu and select Lower Pane to show the bottom pane.
- Open the View menu again and pick DLL View or Handle View to choose what the bottom pane lists.
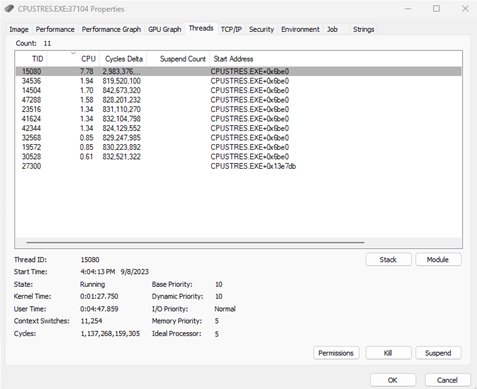
- Double-click the process to open its Properties dialog for the path, threads, stacks and security details.
- Hover over a service host process to see a tooltip that names the services running inside it.
If the tool is not on your PC yet, open Process Explorer on Windows 11 straight from Sysinternals Live without saving a copy.
SysInternals Process Explorer tool for Windows PC
Process Explorer is a free Microsoft Sysinternals utility, written by Mark Russinovich, that shows which handles and DLLs each process has opened or loaded.
Microsoft describes it as a comprehensive replacement for Task Manager, useful for tracking down DLL-version problems and handle leaks.
| Detail | Current fact |
|---|---|
| Publisher | Microsoft (Sysinternals), author Mark Russinovich |
| Latest Windows version | Process Explorer v17.21, published November 5, 2026 |
| Runs on | Windows 11 and later; Windows Server 2019 and later |
| Installation | None: run procexp.exe directly |
| Where to get it | Microsoft Learn download page, Sysinternals Live, or the Sysinternals Suite in the Microsoft Store |
| Price | Free |
| What v17.2 added | Efficiency mode support, persistent process activity history, live kernel memory dumps, a memory map explorer, a Devices page in System Information and NPU monitoring |
| Other platforms | Process Explorer 1.0 for macOS, released November 5, 2026 |
Install Sysinternals Process Explorer on Windows 11
Process Explorer has no installer. Pick the route that matches how often you need it.
| Your situation | Get it this way | Why |
|---|---|---|
| One-off check on any PC | Type \\live.sysinternals.com\tools\procexp.exe in the File Explorer address bar |
Runs from the web, nothing saved |
| Regular use on your own PC | The Process Explorer download on Microsoft Learn | A local procexp.exe you can pin or keep on a USB drive |
| You want every Sysinternals tool kept up to date | Sysinternals Suite from the Microsoft Store | Adds Process Explorer to Start and to the path as procexp.exe |
The Process Explorer download for Windows 11 and 10 lists the file size and the official links. On Windows 11, the Store version groups the tools in a Sysinternals Suite folder in Start; Windows 10 lists them without the folder.
Process Explorer upper pane and lower pane explained
The top pane always lists the active processes. The bottom pane depends on the mode you pick from the View menu.
| Part of the window | What it shows | Use it to |
|---|---|---|
| Top pane (process tree) | Running processes, their parent process and the owning account | See which program started a process |
| Lower pane in Handle View | Files, folders, registry keys and other handles the selected process has open | Find a file lock or a handle leak |
| Lower pane in DLL View | DLLs and memory-mapped files the selected process has loaded | Track down a DLL-version problem |
| Toolbar graphs | CPU, I/O, memory and GPU activity, with history in tooltips | Spot a spike and when it happened |
| Service tooltips | The services hosted inside a shared service process | Tell one service host from another |

Find which process has a file open with Process Explorer
When Windows says a file is in use, the search in Process Explorer shows which processes hold a handle to it or have a DLL with that name loaded.
- Start Process Explorer as administrator so the search covers every process.
- Open the Find menu and choose the handle or DLL search.
- Type part of the file or folder name, for example the document name, and start the search.
- Read the results: each row names the process and the matching handle or DLL.
- Select a result, then switch the lower pane to Handle View to see the full path the process holds.
- Close the file in that program, or exit the program normally, then retry the file.
Microsoft's command-line Handle utility answers the same question from a prompt, for example handle report.docx, and warns that closing a handle from outside the program can make it or Windows unstable.
How to show DLLs and handles in Process Explorer
- Select the process you want to inspect in the top pane.
- Open the View menu and select Lower Pane if the bottom pane is hidden.
- Open the View menu and select DLL View to list loaded DLLs and memory-mapped files.
- Open the View menu and select Handle View to list open files, registry keys and other objects.
- Right-click a column header in the lower pane and select Select Columns to add DLL or handle columns.
- Select a different process in the top pane; the lower pane refreshes for it.
Add columns in Process Explorer
The default columns hide much of what the tool collects. Column groups cover process image details, performance, I/O, GPU, handles, DLLs and .NET.
- Right-click any column header in the top pane.
- Select Select Columns.
- Move through the tabs and tick the columns you want, such as Verified Signer for the publisher who signed each file.
- Select OK.
- Drag a column header left or right to change the order, and click a header to sort by it.
Use Process Explorer to troubleshoot high CPU usage
Microsoft's high-CPU guidance uses Process Explorer to go one level below Task Manager: from the busy process to the busy thread and the code it is running.
- Run Process Explorer as an administrator.
- Click the CPU column header so the busiest process sits at the top.
- Double-click that process, or right-click it and select Properties.
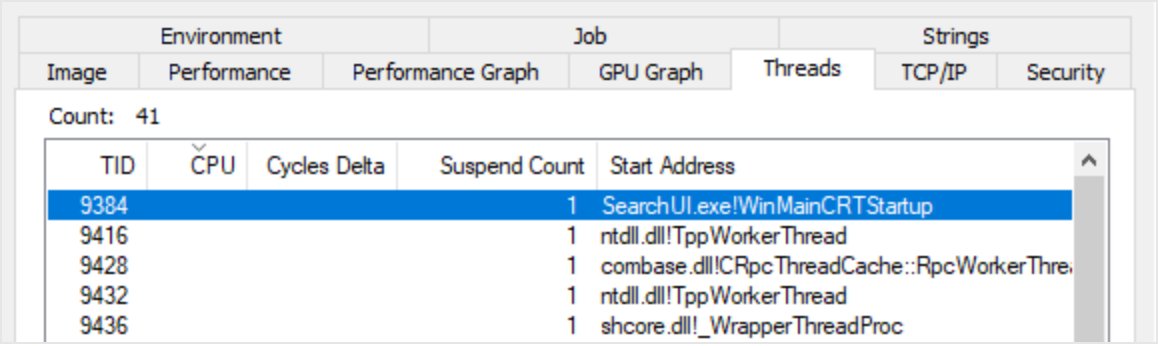
- Select the Threads tab and find the thread with the highest CPU.
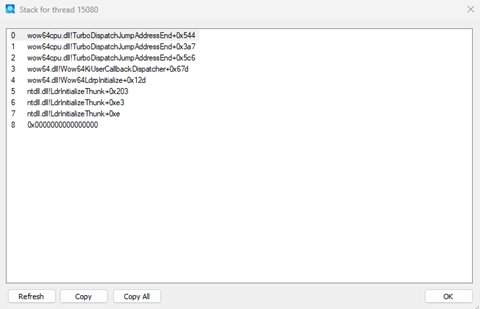
- Select that thread, then select Stack to see the functions it is running.
- Select Refresh to update the stack; it does not refresh on its own, and the minimum interval is one second.
Without symbols, the start address reads like SearchUI.exe+0x120cd0. With symbols configured, it shows a function name such as SearchUI.exe!WinMainCRTStartup.
Configure symbols in Process Explorer
Symbols turn hexadecimal offsets in thread stacks into readable function names. Install Debugging Tools for Windows first, because Process Explorer needs its dbghelp.dll.
| Field in Options > Configure Symbols | Value Microsoft documents |
|---|---|
| Dbghelp.dll path | C:\Program Files (x86)\Windows Kits\10\Debuggers\x64\dbghelp.dll |
| Symbols path | srv*c:\symbols*https://msdl.microsoft.com/download/symbols |
Run Process Explorer as administrator, open the Options menu, select Configure Symbols, enter both values and select OK. The folder that holds dbghelp.dll must also contain symsrv.dll when the path uses the symbol server.
Check a suspicious process with Process Explorer
A process name proves nothing, because malware often borrows the names of real Windows processes like svchost. Check who signed the file and where it starts from.
- Add the Verified Signer column through Select Columns and look for unsigned files or unexpected publishers.
- Double-click the process and read its image path in Properties; a system file normally lives under
C:\Windows. - Look at the Autostart Location field in Properties, then select Explore to jump to the entry that starts it.
- Drag the Find Window target tool from the toolbar onto any unknown window to select the process that owns it.
- Turn on VirusTotal checks in Process Explorer to see how many antivirus engines flag the file's hash.
Check a file on VirusTotal with Sysinternals Sigcheck
Sigcheck, another Sysinternals tool, gives the same verdict from a prompt. It shows the digital signature and can query VirusTotal by file hash.
sigcheck -vt -v C:\path\to\file.exe-v queries VirusTotal using the file's hash, and -vt accepts the VirusTotal terms of service so the tool does not prompt you. Add s (-vs) to upload a file VirusTotal has not seen before.
You should see: The output shows the signature details plus the VirusTotal result; a file VirusTotal does not know, or any non-zero detection, is the cue to look closer.
Process Explorer System Information graphs explained
The System Information window holds full-size versions of the toolbar graphs. Hover over a graph to read its historical values.
| Graph or page | What it tracks |
|---|---|
| CPU | Processor use over time, with past values in the tooltip |
| Memory | System commit against the commit limit (physical memory plus page file) |
| I/O | Input and output activity across processes |
| GPU | Graphics processor activity |
| NPU | Neural processing unit activity, added in v17.2 |
| Devices | A page added to System Information in v17.2 |
Replace Task Manager with Process Explorer
Process Explorer can take over Task Manager's keyboard shortcuts so it opens whenever you press Ctrl + Shift + Esc.
- Run Process Explorer as administrator.
- Open the Options menu.
- Select Replace Task Manager.
- Open Options again and select Minimize to Tray if you want it to wait in the notification area.
- Press Ctrl + Shift + Esc to confirm Process Explorer opens instead of Task Manager.
Process Explorer vs Task Manager
| Task | Task Manager | Process Explorer |
|---|---|---|
| See which process started another | Flat list in Details | Parent-child process tree |
| Find who has a file open | Not available | Find search across handles and DLLs |
| List loaded DLLs and open handles | Not available | Lower pane DLL View and Handle View |
| Check the file signer | Not shown in Details | Verified Signer column |
| Inspect thread stacks | Not available | Properties > Threads > Stack |
| Ships with Windows | Yes | No, a free Microsoft download |
Sysinternals Process Explorer on a remote computer
Process Explorer's documentation lists only local use. For another PC, Microsoft points to two PsTools commands that work across the network.
| Job | Tool | Example |
|---|---|---|
| List processes on another PC | PsList | pslist \\PC01 -t shows the remote process tree |
| See thread or memory detail | PsList | pslist \\PC01 -d or -m |
| End a process on another PC | PsKill | pskill \\PC01 -u admin notepad prompts for the password |
| End a process and its descendants | PsKill | pskill -t \\PC01 1234 |
PsKill needs no client on the target computer, but the account needs administrative rights there, or you supply an admin account with -u.
Sysinternals Process Explorer FAQ
Is Sysinternals Process Explorer safe?
Yes. Process Explorer is published by Microsoft as part of Sysinternals and is downloaded from Microsoft Learn, Sysinternals Live or the Microsoft Store. Get it only from those sources, and check that the publisher is Microsoft Corporation before you run it.
What does Sysinternals do?
Sysinternals is Microsoft's collection of free advanced utilities for diagnosing and troubleshooting Windows. It includes Process Explorer, Process Monitor, Autoruns, ProcDump and the PsTools, covered in the official book Troubleshooting with the Windows Sysinternals Tools.
How do I use Sysinternals Process Explorer?
Run procexp.exe as administrator, read the process tree in the top pane, then open View > Lower Pane and pick DLL View or Handle View. Double-click any process to open Properties for its path, threads and stacks.
Does Sysinternals Process Explorer work on Windows 10?
The current Process Explorer page lists Windows 11 and later and Windows Server 2019 and later as supported. Windows 10 is not on that list, so expect the newest releases to target Windows 11.
Does Process Explorer need to be installed?
No. Microsoft's installation note is simply to run procexp.exe. You can also run it from Sysinternals Live or install the Sysinternals Suite from the Microsoft Store, which keeps it updated.
Is Process Explorer part of the Sysinternals Suite?
Yes. The Sysinternals Suite includes Process Explorer, and the Microsoft Store edition adds it to the Start menu and to the path as procexp.exe through an app execution alias.
Can Sysinternals Process Explorer connect to a remote computer?
Its documentation covers the local PC only. Use PsList with \\computer to list processes on another PC, and PsKill with \\computer to end one there.
Is there a Sysinternals Process Explorer for Mac?
Yes. Microsoft released Process Explorer 1.0 for macOS on November 5, 2026, alongside a Linux version of Autoruns.
What is the difference between Process Explorer and Process Monitor?
Process Explorer shows what each process is and what it holds right now: handles, DLLs, threads and resource use. Process Monitor records file system, registry and process activity over time so you can filter the events afterwards.