To calculate the median, sort the numbers from smallest to largest and take the middle value; with an even count, average the two middle values.
This guide covers the manual method for odd and even sets, the median formula for grouped data, and the exact functions for Excel, pivot tables, SQL and Python.
Step by step tutorial to calculate median
These four steps work for any list of numbers, whether you are doing homework by hand or checking a spreadsheet result.
Example data set: 7, 1, 5, 3, 9.
- Arrange the numbers in numerical order, from smallest to largest. The example becomes 1, 3, 5, 7, 9.
- Count the number of data points, including any number that repeats. The example has 5 values.
- Identify the middle position. For an odd count, the middle position is (n + 1) / 2. Here that is (5 + 1) / 2 = 3, so the median is the 3rd value.
- Find the median by reading the value at that position. The 3rd value in 1, 3, 5, 7, 9 is 5.
- If the count is even, there is no single middle value. Take the two middle values and average them, as shown in the next section.
Half the values sit below the median and half sit above it. That balance is the whole definition, and it is how you can check any answer later.
How to calculate median with an even number set
An even set has two middle values, so the median is their average. The result does not have to be a number that appears in the data.
- Sort the numbers. Example: 2, 3, 3, 5, 7, 10.
- Count them. This set has 6 values.
- Find the two middle positions: n / 2 and (n / 2) + 1. With 6 values, those are the 3rd and 4th positions.
- Read those two values. The 3rd value is 3 and the 4th value is 5.
- Add them and divide by 2: (3 + 5) / 2 = 4. The median of 2, 3, 3, 5, 7, 10 is 4.
Excel, Google Sheets, SQL Server's PERCENTILE_CONT and Python's statistics.median all use this same average-of-the-middle-two rule for even sets.
Median formula for odd, even and grouped data
In each formula, n is the number of values after sorting. The grouped formula is for frequency tables, where you only know how many values fall in each class.
| Data type | Median formula | Worked example |
|---|---|---|
| Odd count of values | Median = value at position (n + 1) / 2 | 1, 3, 5, 7, 9: position 3, median 5 |
| Even count of values | Median = (value at n / 2 + value at n / 2 + 1) / 2 | 2, 3, 3, 5, 7, 10: (3 + 5) / 2 = 4 |
| Grouped data (frequency table) | Median = L + ((n / 2 – CF) / f) x h | See the age-group example below |
| Grouped data terms | L = lower limit of the median class, CF = cumulative frequency before it, f = its frequency, h = class width | Median class: the first class whose cumulative frequency reaches n / 2 |
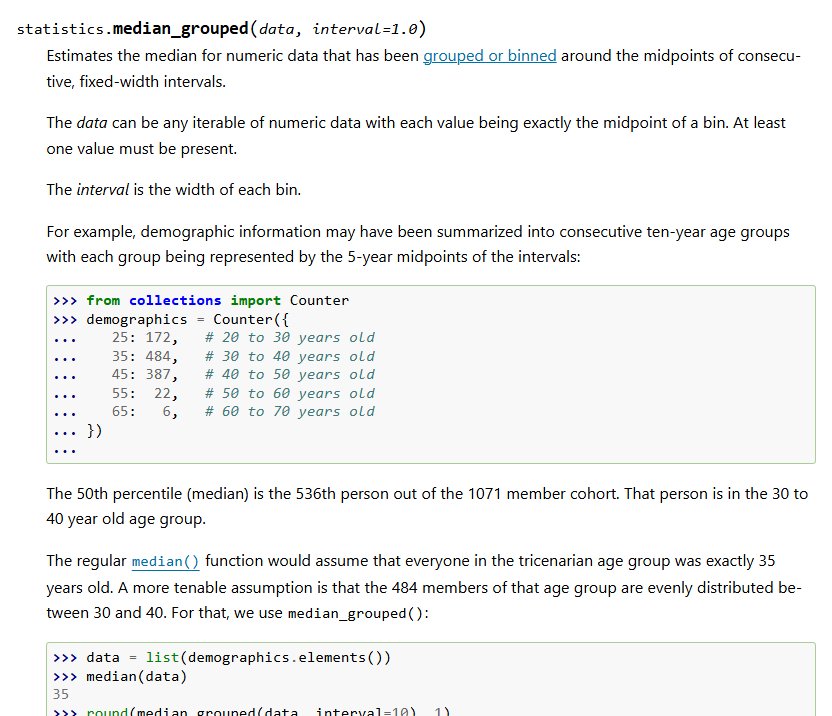
Grouped example: 1,071 people in ten-year age groups, with 172 aged 20 to 30, 484 aged 30 to 40, 387 aged 40 to 50, 22 aged 50 to 60 and 6 aged 60 to 70.
Here n / 2 = 535.5, so the median class is 30 to 40. With L = 30, CF = 172, f = 484 and h = 10, the median is 30 + ((535.5 – 172) / 484) x 10 = 37.5 years, the same result Python's median_grouped() returns for this data.
How to calculate median in Excel
The MEDIAN function takes from 1 to 255 numbers, cell ranges or names, and it averages the two middle numbers when the count is even.
- Enter your numbers in one column, for example 10, 7, 9, 27, 0 and 4 in cells A1 to A6.
- Select an empty cell for the result.
- Type
=MEDIAN(A1:A6)and press Enter. The cell shows 8. - To use the dialog instead, select the Formulas tab, then select AutoSum > More Functions.
- Type MEDIAN in the Search for a function box and select OK (or Next in Excel for the web).
- Type
A1:A6in the Number1 box, then select OK (or Insert in Excel for the web).
Excel ignores text, logical values and empty cells inside a range, but it counts cells that contain zero. Google Sheets uses the same =MEDIAN(A1:A6) syntax and also ignores text.
To get all three averages side by side, you can find mean, median and mode in Excel with matching functions.
How to calculate median in an Excel pivot table
A standard PivotTable cannot show a median. The Summarize Values By list offers Sum, Count, Average, Max, Min, Product, Count Numbers, StDev, StDevp, Var, Varp and Distinct Count, but no Median.
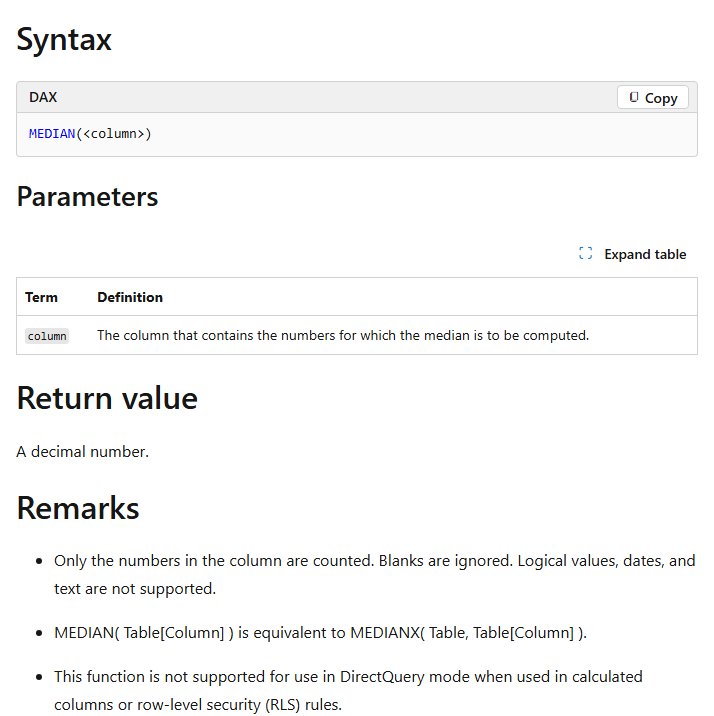
The route that works is a Data Model PivotTable with a DAX measure, because DAX has its own MEDIAN function that measures can use.
- Format the source data as a table: select a cell in it, then select Insert > Table.
- Select Insert > PivotTable.
- Tick Add this data to the Data Model, choose New Worksheet, and select OK.
- Select Power Pivot > Calculations > Measures > New Measure.
- Under Table name, pick your table, and type a name such as Median Salary in Measure Name.
- In the Formula box, after the equals sign, enter
MEDIAN(Table1[Salary]), using your own table and column names. - Select Check Formula, then OK, and drag the new measure into the Values area of the PivotTable.
The DAX MEDIAN function counts only numbers and ignores blanks. It does not accept dates, text or logical values.
How to calculate median in SQL
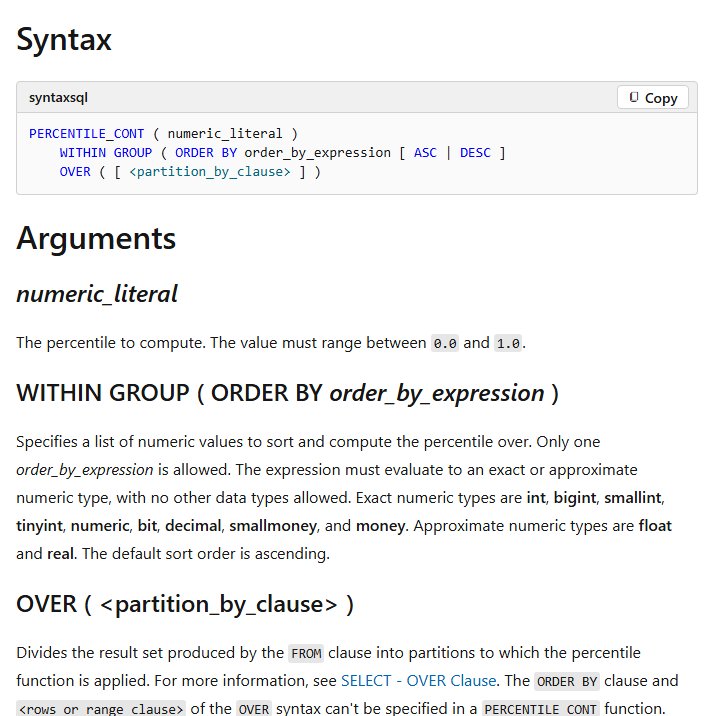
SQL Server and Azure SQL have no MEDIAN function. Use PERCENTILE_CONT(0.5), which returns the 50th percentile, interpolating between the two middle values when the count is even.
SELECT DISTINCT PERCENTILE_CONT(0.5) WITHIN GROUP (ORDER BY Salary) OVER () AS MedianSalary FROM dbo.Employees;0.5 asks for the 50th percentile, WITHIN GROUP sets the column to sort, and OVER () applies it to the whole table. Add PARTITION BY Department inside OVER () to get one median per department. Null values are ignored.
You should see: One row with a MedianSalary column, returned as a float.
In SQL Server, PERCENTILE_CONT needs the OVER clause, because its aggregate form is not supported there. Use PERCENTILE_DISC(0.5) instead when the answer must be a value that exists in the column.
PostgreSQL accepts the aggregate form directly: SELECT percentile_cont(0.5) WITHIN GROUP (ORDER BY salary) FROM employees;.
How to calculate median in Python
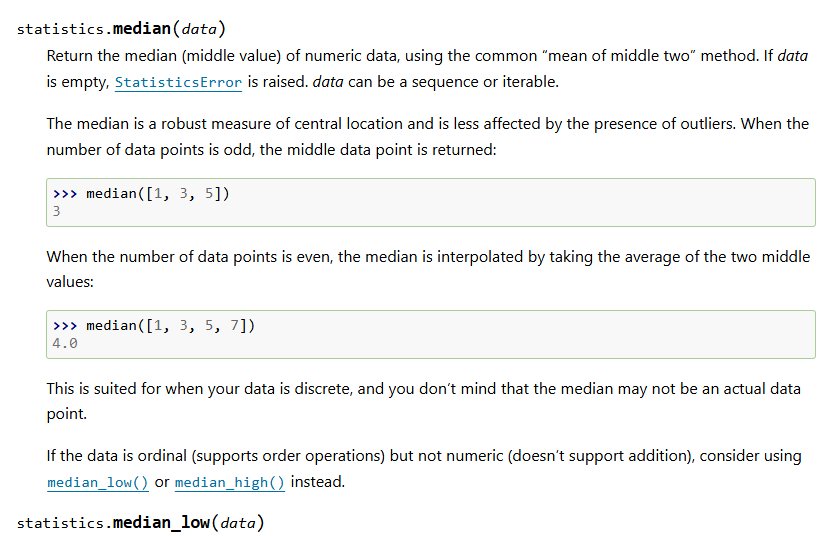
Python's built-in statistics module has a median() function, so no extra package is needed. It averages the two middle values for an even count.
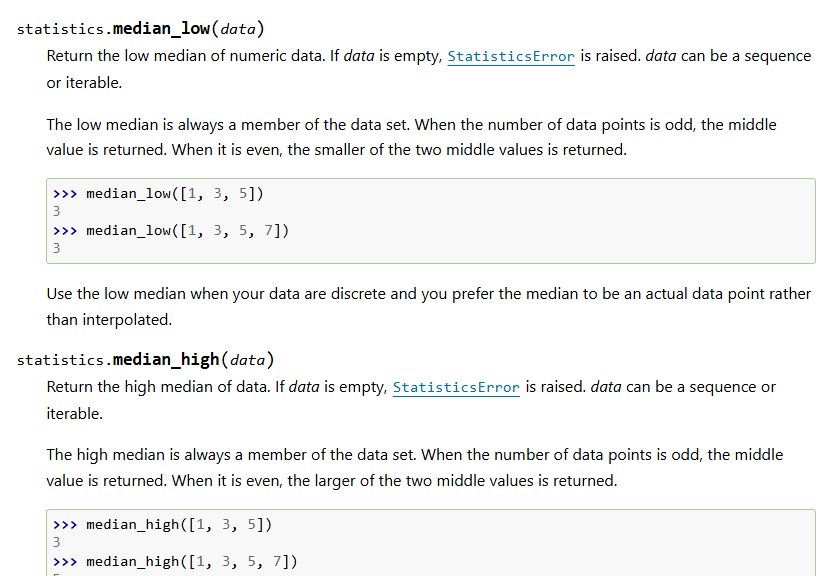
python -c "from statistics import median; print(median([10, 7, 9, 27, 0, 4]))"median() sorts the data itself, so the list can be in any order. median_low() and median_high() return the lower or higher middle value instead of their average, and median_grouped() estimates the median of binned data.
You should see: The output is 8.0, the average of the two middle values 7 and 9.
An empty list raises StatisticsError. Strip NaN values before calling median(), because NaN breaks sorting and gives an undefined result.
How to calculate median salary and median age
Median salary and median age use the same sorting method; the only difference is the data. Each row below is a complete worked example.
| Question | Sorted data | Median | Mean, for comparison |
|---|---|---|---|
| Median salary of 5 staff | $42,000, $48,000, $51,000, $55,000, $250,000 | $51,000 (3rd of 5) | $89,200 |
| Median age of 6 people | 12, 15, 34, 36, 41, 67 | 35 ((34 + 36) / 2) | 34.2 |
| Median age from age groups | Frequency table of 1,071 people | 37.5 (grouped formula) | Not exact from grouped data |
The single $250,000 salary pulls the mean up to $89,200, while the median stays at $51,000. That gap is why the median describes typical pay better than the mean.
How to check if a median is correct
- Count the values below your median and the values above it. The two counts should be equal.
- For an even set, confirm the median lies between the two middle values, not on one of them unless they are equal.
- Check that every repeated value was counted. A list with two 3s has two data points, not one.
- Paste the same numbers into Excel or Google Sheets and compare your answer with
=MEDIAN(range). - If the spreadsheet result differs, look for blank cells, text-formatted numbers or zeros in the range.
Why do we calculate median instead of mean?
The median resists outliers: one extreme value barely moves it. The mean adds every value, so a single outlier can drag it far from a typical case.
| Your data | Better measure | Why |
|---|---|---|
| Incomes, house prices, response times | Median | A few very large values skew the mean upward |
| Test scores spread evenly around the centre | Either | In a symmetrical distribution the mean, median and mode are the same |
| Ranked answers such as survey ratings | Median (low or high median) | Ordinal data can be sorted but not meaningfully averaged |
| Totals you need to rebuild, such as budget per person | Mean | Mean x count gives back the total; the median does not |
Mean, median and mode: What is the difference?
| Measure | How to calculate it | Result for 2, 3, 3, 5, 7, 10 |
|---|---|---|
| Mean (average) | Add all values and divide by the count | 30 / 6 = 5 |
| Median | Sort the values and take the middle one, or average the middle two | (3 + 5) / 2 = 4 |
| Mode | Find the value that occurs most often | 3 |
All three describe the centre of a data set. They match in a symmetrical distribution and drift apart when the data is skewed, as the salary example shows.
Tips for calculating median
| Tip | Why it matters |
|---|---|
| Always sort before you pick the middle value | The middle of an unsorted list is just a random value |
| Keep every repeated number in the list | Repeats are separate data points and change the count |
| Decide whether zeros are real data | Excel counts zero cells but ignores blank cells, so a 0 typed as a placeholder changes the median |
| Remove text, error values and NaN first | Excel returns an error for error values, and Python gives an undefined result with NaN |
| Use median_low, median_high or PERCENTILE_DISC when the answer must exist in the data | The usual even-set median is an average that may not be one of the values |
| Use the grouped formula for frequency tables | A plain median treats every value in a class as its midpoint, while the formula spreads them evenly across the class |
| Report the median for skewed data such as pay | It reflects a typical case better than the mean |
How to calculate median FAQ
What is the median?
The median is the middle number in a sorted list, so half the values are greater and half are smaller. For 1, 3, 5, 7, 9 the median is 5. With an even count, it is the average of the two middle numbers.
How is the median calculated?
Sort the values from smallest to largest, count them, and find the middle position. For an odd count, take the value at position (n + 1) / 2. For an even count, average the values at positions n / 2 and n / 2 + 1.
How do you find the median with an even number of data points?
Take the two middle values after sorting and average them. For 2, 3, 3, 5, 7, 10, the middle values are 3 and 5, so the median is (3 + 5) / 2 = 4. The result does not have to appear in the data.
What if the numbers repeat in the data set?
Count each repeat as its own data point and keep it in the sorted list. In 2, 3, 3, 5, 7, 10 the two 3s are both counted, which makes six values. Repeats can also make the median equal one of the repeated values.
Can the median be the same as the mean?
Yes. In a symmetrical data set, such as 1, 3, 5, 7, 9, the mean and median are both 5. They drift apart when the data is skewed, for example when one salary is far higher than the rest.
Why is the median important?
The median shows a typical value that one extreme number cannot distort. That makes it the standard measure for incomes, house prices and similar skewed data, where the mean is pulled toward a few very large values.
What is the formula to calculate the median?
For ungrouped data, the median is the value at position (n + 1) / 2 after sorting, or the average of the two middle values when n is even. For grouped data, use Median = L + ((n / 2 – CF) / f) x h.
How do I calculate the median in Excel?
Type =MEDIAN(A1:A6) in an empty cell, replacing A1:A6 with your range, and press Enter. Excel averages the two middle numbers when the count is even, ignores blank cells and text, and counts cells that contain zero.
Can I calculate median in a pivot table?
Not in a standard Excel PivotTable, because Summarize Values By has no Median option. Add the data to the Data Model when creating the PivotTable, then create a measure with the DAX formula MEDIAN(Table[Column]).
How do you calculate median in SQL?
In SQL Server, use PERCENTILE_CONT(0.5) WITHIN GROUP (ORDER BY column) OVER (). Add PARTITION BY inside OVER for one median per group. PostgreSQL accepts percentile_cont(0.5) WITHIN GROUP (ORDER BY column) as a normal aggregate.
How do you calculate median in Python?
Import median from the built-in statistics module and pass it a list: median([10, 7, 9, 27, 0, 4]) returns 8.0. The function sorts the data itself and averages the two middle values for an even count.
How do you explain the median simply?
Line everyone up from shortest to tallest and pick the person standing in the middle. Their height is the median. If two people share the middle, the median is halfway between their two heights.