To find a memory leak in Windows 11 or 10, watch which process keeps growing in Task Manager or Performance Monitor, then fix it by restarting, updating or removing that app or driver.
This guide covers how to confirm a leak, how to tell an app leak from a driver leak, the Microsoft tools that pin it down, and how to keep leaks from coming back.
Find the process that is leaking memory with Task Manager
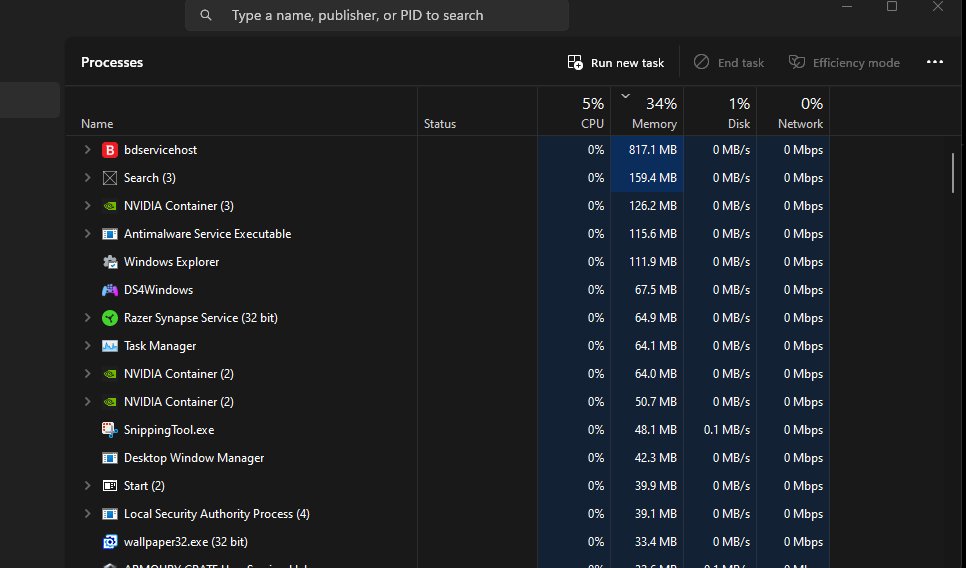
A leak shows up as one process whose memory figure keeps climbing while you are not asking it to do more work. Task Manager is enough to spot that pattern in a few minutes.
- Press Ctrl + Shift + Esc to open Task Manager.
- Select More details if the window opens in compact view.
- Open the Processes tab and select the Memory column header to sort by memory use.
- Note the memory figure for the top three or four processes.
- Leave the PC idle with those apps open for 15 to 30 minutes, then check the figures again.
- Treat a process whose memory keeps rising while idle, and never drops back, as the likely leak.
- Right-click that process and select End task to release the memory right away.
Ending the task frees the memory but does not cure the leak. The fix is an update, a setting change or a replacement for that app, covered below.
Memory leaks in Windows 11/10
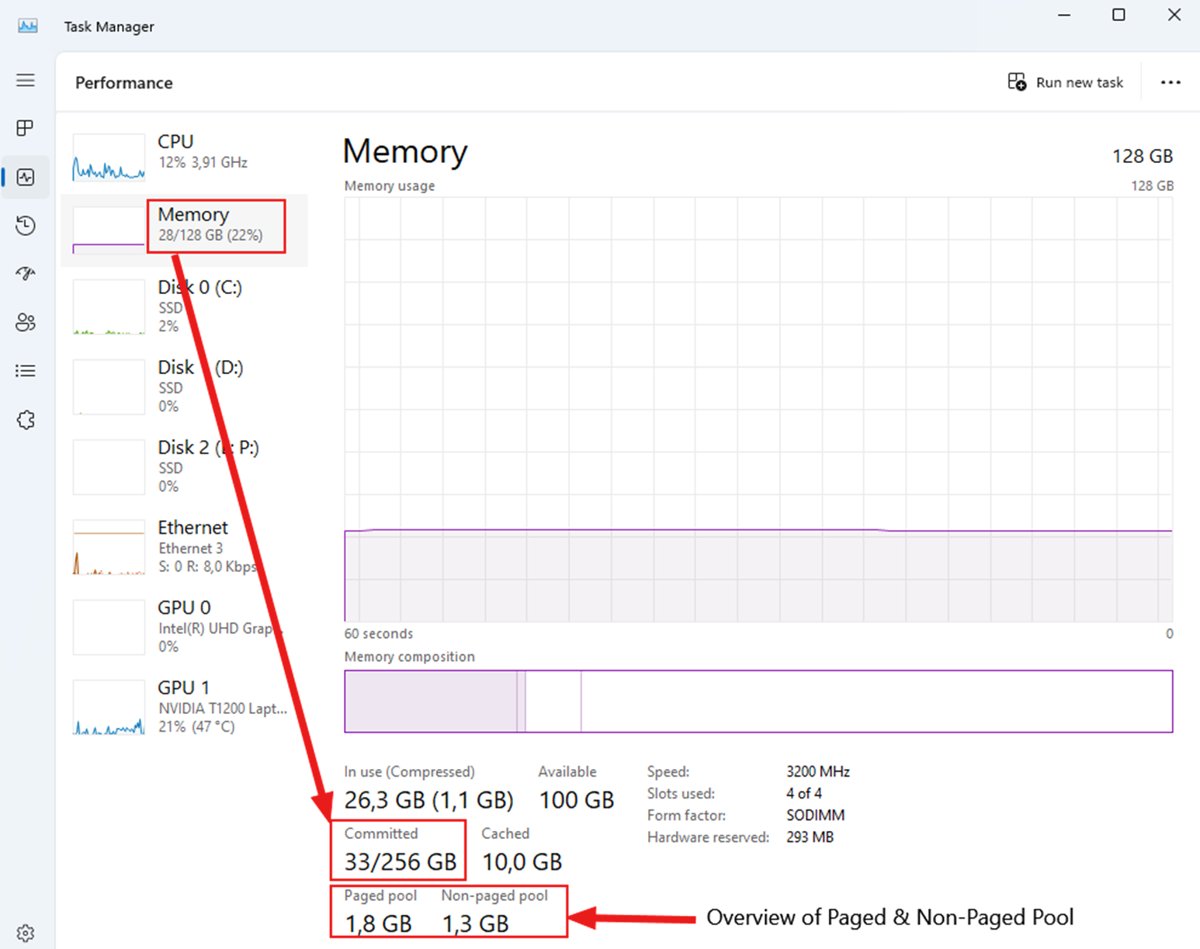
Microsoft defines a memory leak as a process that allocates memory from the paged or nonpaged pool and never frees it. As free memory drains, Windows slows down and can eventually fail.
| Question | Answer |
|---|---|
| What leaks | An app, a background service, a Windows component or a device driver |
| How memory allocation occurs | A program asks Windows for memory while it runs and is expected to release it when it finishes with it |
| Why a memory leak is bad | Memory that is never released is unavailable to every other app until the leaking process ends or the PC restarts |
| User-mode leak | Caused by an application; always in the paged pool, so Pool Paged Bytes and paging file usage rise steadily |
| Kernel-mode leak | Caused by a driver or Windows component; usually drains the nonpaged pool, so Pool Nonpaged Bytes rises |
| Typical symptoms | The PC gets slower the longer it stays on, memory use stays high after apps are closed, low-memory warnings, and crashes after long uptime |
| How fast it builds | Usually slowly; Microsoft notes it can take hours to reach a level you can detect |
High memory use on its own is not a leak. A browser with 40 tabs uses a lot of RAM legitimately. A leak is memory that keeps growing without a matching increase in work.
Microsoft tools to diagnose memory leaks
| Your situation | Use this tool | What it tells you |
|---|---|---|
| You want a quick look at which app is growing | Task Manager | Live memory use per process, sortable on the Processes tab |
| You are not sure a leak exists at all | Performance Monitor (perfmon) | Graphs paged pool, nonpaged pool and paging file use over hours |
| You know the leak is in an app | Performance Monitor with Process counters | Private Bytes and Virtual Bytes for each suspect process |
| You need the exact routine inside an app | UMDH (user-mode dump heap) | Which allocation call is not being freed; aimed at developers |
| Nonpaged pool keeps rising | PoolMon (Windows Driver Kit) | The pool tag, and so the driver, that keeps allocating |
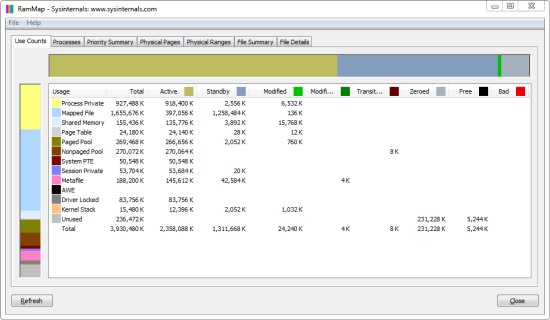
| You want to see where physical RAM went | RAMMap (Sysinternals) | Use by type, per-process working sets and file data cached in RAM |
| You suspect faulty RAM rather than a leak | Windows Memory Diagnostic | Whether the memory hardware itself has errors |
How to locate the memory leak with Performance Monitor
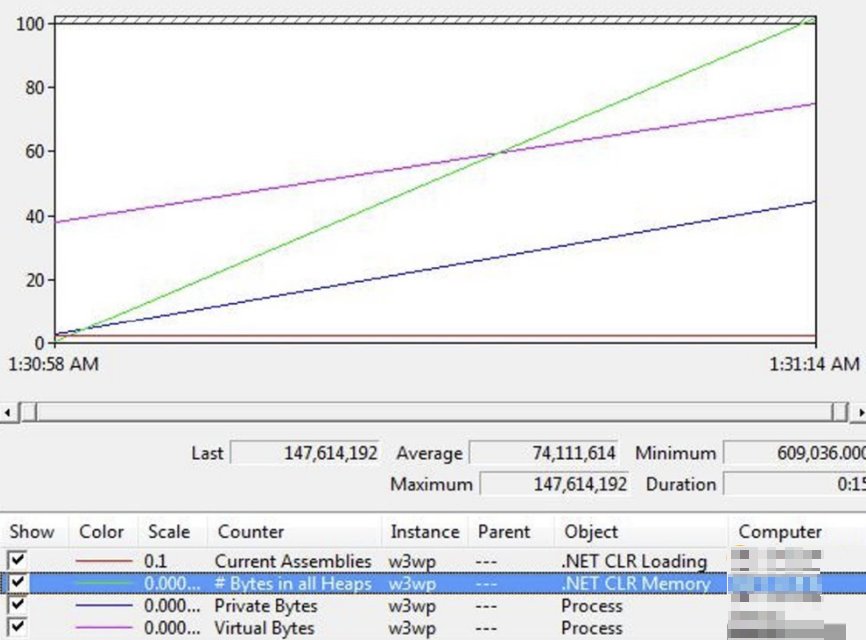
Performance Monitor does not name the culprit, but it proves whether a leak exists and whether it sits in the paged or nonpaged pool. Run it for several hours for a reliable result.
- Type perfmon in Windows Search, right-click Performance Monitor and select Run as administrator.
- Under Monitoring Tools, right-click Performance Monitor and select Properties.
- On the Data tab, add Memory > Pool Nonpaged Bytes, Memory > Pool Paged Bytes and Paging File > % Usage.
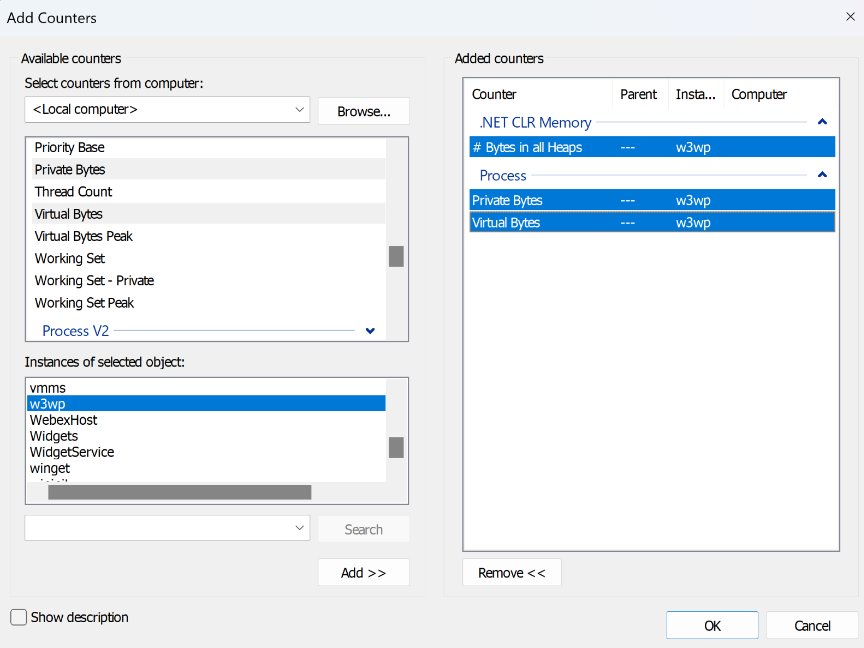
- To check a single app, also add Process > Private Bytes and Process > Virtual Bytes for that process.
- On the General tab, set Sample every to 600 seconds, which takes a reading every 10 minutes.
- Set Duration to 86400 seconds to record 24 hours, then select OK.
- Start the suspect app and leave the PC unused while it records.
- After several hours, read the graph: a line that climbs steadily and never levels off points to the leak.
Counters swing sharply in the first minutes, so judge the trend over hours, not the start. Microsoft also recommends logging the graph to a file so you can examine it later.
How to tell an app leak from a driver leak
| What Performance Monitor shows | Where the leak is | Next step |
|---|---|---|
| Pool Paged Bytes and Paging File % Usage rise steadily | User mode: an application or service | Add Process > Private Bytes per app to find which one |
| Private Bytes or Virtual Bytes of one process keeps climbing | That process | Update, reset or remove that app |
| Pool Nonpaged Bytes keeps rising | Kernel mode: usually a driver | Use PoolMon to find the pool tag and the driver behind it |
| Counters climb, then level off and stay flat | Probably caching, not a leak | No action needed |
Microsoft notes that kernel-mode counters occasionally give false positives when an application is caching data. Wait several hours before you decide.
Find a driver memory leak with PoolMon
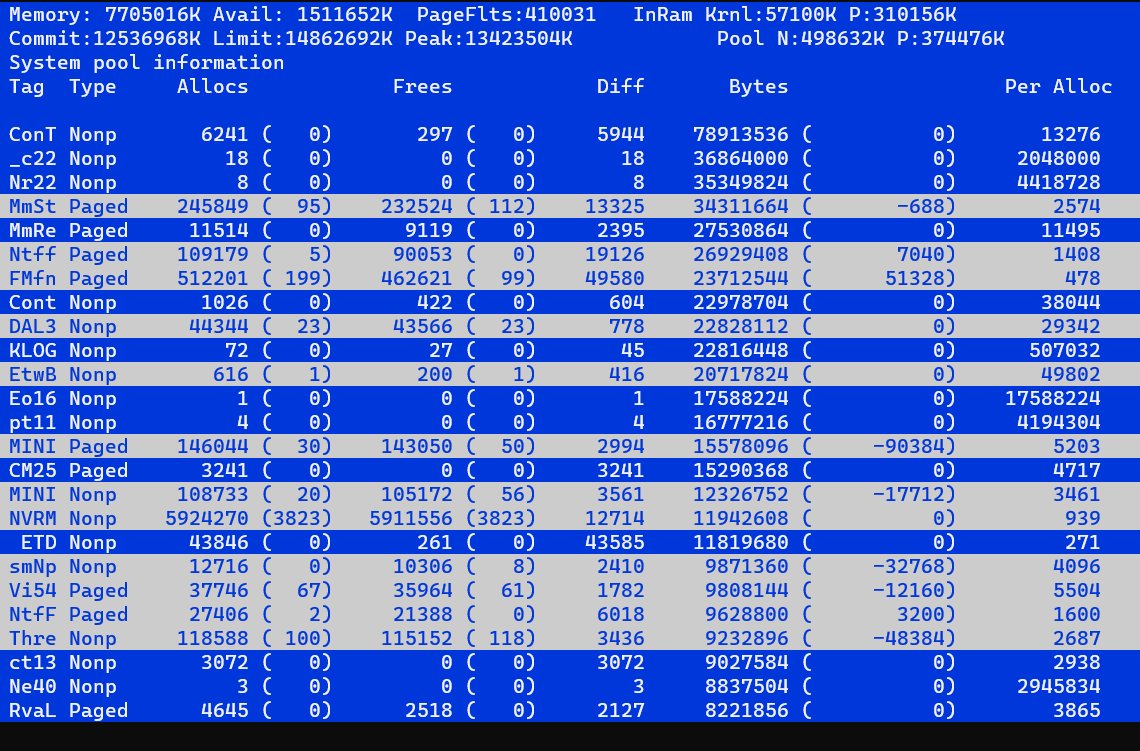
PoolMon (poolmon.exe) ships with the Windows Driver Kit and lists pool memory by pool tag. The tag that keeps growing belongs to the driver that is leaking.
- Open an elevated Command Prompt in the WDK tools folder and start poolmon.
- Press P once to show only the nonpaged pool, twice for the paged pool, or press Enter to show both if you are unsure.
- Press B to sort the tags by byte use.
- Start the workload that triggers the slowdown and save a screenshot of the output.
- Save a new copy of the output every 30 minutes.
- Compare the copies and note which tag's bytes keep increasing.
- Press Q to quit PoolMon.
Run poolmon /g with the path to the WDK's pooltag.txt file to add a Mapped_Driver column that names the driver for each tag. Once you know the driver, update or roll it back from the device maker.
How to fix a memory leak in Windows 11/10
Once you know the process, the fix is about that process. Work down this list and stop when memory use stays flat over a full day.
- Close the leaking app or select End task on it in Task Manager to reclaim memory now.
- Restart the PC from Start > Power > Restart, then open only the apps you need.
- Update the app from its publisher or the Microsoft Store, since leaks are bugs that vendors patch.
- Install Windows updates from Start > Settings > Windows Update > Check for updates.
- Check Windows Update > Advanced options > Optional updates for newer drivers.
- If PoolMon pointed to a driver, install the latest version from the device or PC maker's site.
- If the leak continues after updating, uninstall the app and use an alternative until the vendor fixes it.
Common leak sources each have their own fix: the Hyper-V and WSL process when Vmmem uses too much memory, the WebView2 process eating memory, and Java apps where OpenJDK Platform Binary uses high memory.
How to prevent memory leaks in Windows
- Press Ctrl + Shift + Esc, select Startup apps and right-click apps you do not need at sign-in, then select Disable.
- Keep Windows current through Settings > Windows Update so fixed components arrive automatically.
- Keep apps that run all day, such as browsers and chat clients, on automatic updates.
- Restart the PC regularly instead of leaving it in sleep for weeks, which clears memory a slow leak has built up.
- Close apps you have finished with from the Processes tab rather than leaving them in the background.
- Recheck the Memory column in Task Manager after installing a new app or driver, so a new leak is caught early.
How to test RAM in Windows 11
Faulty RAM causes crashes that look like a leak. Run Windows Memory Diagnostic to rule out the hardware before you spend hours on software.
- Save your work and close all apps.
- Right-click Start, select Run, type mdsched and select OK.
- Select Restart now and check for problems (recommended).
- For a more thorough pass, press F1 on the test screen, change Test Mix from Standard to Extended with the arrow keys, then press F10.
- Wait for the tests to finish; Windows restarts to the sign-in screen on its own.
- Sign in and read the Windows Memory Diagnostic notification for the result.
If you miss the notification, open Event Viewer and look for the MemoryDiagnostics-Results log under Applications and Services Logs > Microsoft > Windows. Event ID 2001 means no memory errors were found. The same steps work on Windows 10.
Memory leak troubleshooting in Windows 11/10
Memory use stays high after closing every app
A background service or a driver keeps memory that Task Manager's app list does not show.
- Open Performance Monitor and add Memory > Pool Nonpaged Bytes and Memory > Pool Paged Bytes.
- Record for several hours with the PC idle.
- If nonpaged pool climbs, use PoolMon to find the tag and the driver, then update that driver.
No single process in Task Manager looks large
The memory is held by the kernel, the file cache or many small processes.
- Open RAMMap from Microsoft Sysinternals.
- Check the Use Counts tab for which memory type is large.
- Check the Processes tab for working set sizes per process.
The browser keeps growing the longer it runs
A tab, extension or browser bug that does not free memory.
- Update the browser to the latest version.
- Disable extensions one at a time and recheck memory use.
- Restart the browser; Firefox users can apply the fix for the Firefox memory leak.
The PC crashes or shows blue screens after long uptime
Memory exhaustion from a leak, or faulty RAM.
- Run Windows Memory Diagnostic with mdsched to rule out hardware.
- If the RAM passes, record Performance Monitor counters until the next slowdown.
- Update the driver or app the counters point to.
Windows memory leak FAQ
Does restarting fix a memory leak?
Restarting releases all leaked memory, so the PC runs normally again for a while. It does not fix the cause. The leaking app or driver starts leaking again once it runs, so you still need to update or remove it.
Is high memory usage the same as a memory leak?
No. High memory use can be normal when you run heavy apps or many browser tabs. A leak is memory use that keeps growing over hours without more work being done, and is not released until the process ends.
Can a memory leak damage my RAM?
No. A memory leak is a software fault and does not harm the memory chips. It only makes memory unavailable to other apps until the leaking process closes or Windows restarts.
Can a driver cause a memory leak?
Yes. Drivers run in kernel mode and usually leak from the nonpaged pool. Performance Monitor shows Pool Nonpaged Bytes rising, and PoolMon identifies the pool tag and the driver that owns it.
Will adding more RAM fix a memory leak?
No. More RAM only delays the point at which the leak slows the PC. The leaking process keeps taking memory until it ends, so the real fix is updating, reconfiguring or replacing it.
How long should I monitor to confirm a memory leak?
Microsoft suggests several hours and gives a 24-hour Performance Monitor example sampling every 10 minutes. Leaks usually build slowly, and counters swing at the start before they settle.
What is the difference between paged and nonpaged pool leaks?
Paged pool memory can be moved to the page file, and user-mode app leaks always sit there. Nonpaged pool must stay in RAM, and kernel-mode driver leaks usually drain it.
Is Windows Memory Diagnostic able to find a memory leak?
No. Windows Memory Diagnostic tests the RAM hardware for errors. It is useful to rule out faulty memory, but a leak is a software problem that Task Manager, Performance Monitor and PoolMon find.