To test Windows PC performance with built-in tools, watch live CPU, memory, disk and GPU load in Task Manager, run perfmon /report for a 60-second system diagnostics report, check RAM with Windows Memory Diagnostic, and score hardware with winsat.
This guide covers each built-in tool on Windows 11 and Windows 10, when third-party benchmarks add value, how to read CPU, memory, disk and GPU results, and when a slow PC needs a software fix or new hardware.
Quick live checks with Task Manager — fast, practical triage
Task Manager comes first because it opens instantly, needs no setup and shows which process is using the hardware right now. Microsoft notes that monitoring CPU, memory and disk usage helps identify processes slowing your PC.
- Press Ctrl + Shift + Esc to open Task Manager.
- Select More details if it opens in compact view.
- Open the Processes tab and sort by CPU, Memory or Disk to find the heaviest app.
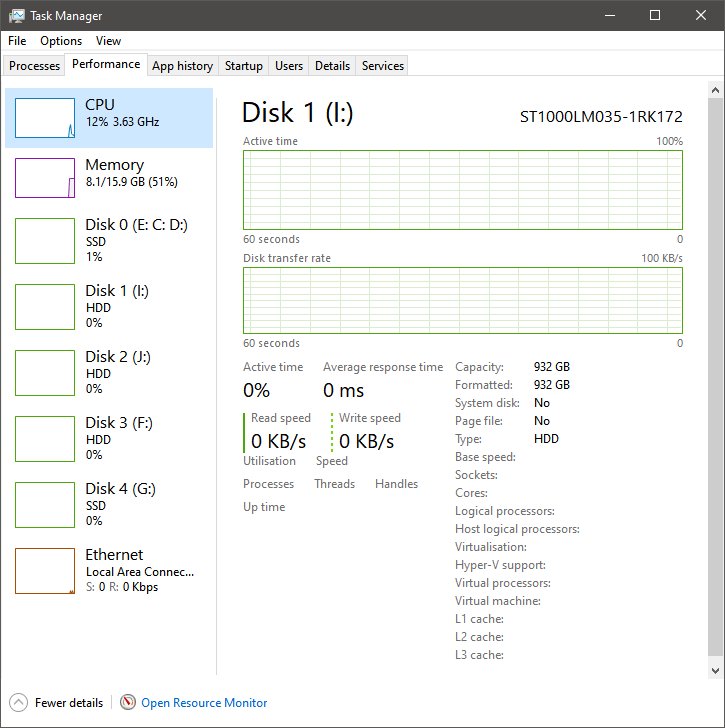
- Open the Performance tab and select CPU, Memory, Disk and GPU in turn to see live graphs.
- Reproduce the slowdown, then note which graph sits near 100%.
- Open Startup apps and disable high-impact apps you do not need.
To use it effectively, keep Task Manager open while the PC is slow, not after the problem has passed. A process that holds one resource near 100% for minutes is the lead to chase.
Windows built-in performance test tools: Task Manager, perfmon, mdsched and winsat
| Your question | Tool | Time | Command or path |
|---|---|---|---|
| What is slowing the PC right now? | Task Manager | 1-2 minutes | Ctrl + Shift + Esc |
| Is there a configuration or driver problem? | Performance Monitor system diagnostics report | A few minutes | perfmon /report |
| Is the RAM faulty? | Windows Memory Diagnostic | Longer with the Extended mix | mdsched |
| How fast is each component? | WinSAT | A few minutes | winsat formal |
| Has the PC become less stable over time? | Reliability Monitor | 1 minute | perfmon /rel |
| How does this PC compare with others? | Third-party benchmark | 10-30 minutes | Vendor app |
Using Performance Monitor (perfmon) — deep, built‑in diagnostics
What it does and when to use it: Performance Monitor is the Windows Reliability and Performance Monitor. Use it when Task Manager shows no obvious culprit, or when you need a written report of hardware, driver and resource warnings.
| Command | What it opens |
|---|---|
| perfmon /report | Starts the System Diagnostics Data Collector Set and shows a report of the results |
| perfmon /res | Resource Monitor view with per-process CPU, memory, disk and network detail |
| perfmon /rel | Reliability Monitor with a day-by-day stability history |
| perfmon /sys | Performance Monitor with live counter graphs |
How to run a System Performance report
perfmon /reportRun it from an elevated Command Prompt or the Run box (Win + R). It starts the System Diagnostics Data Collector Set, collects data, then displays a report of the results in Performance Monitor.
You should see: Performance Monitor opens the System Diagnostics report once collection finishes.
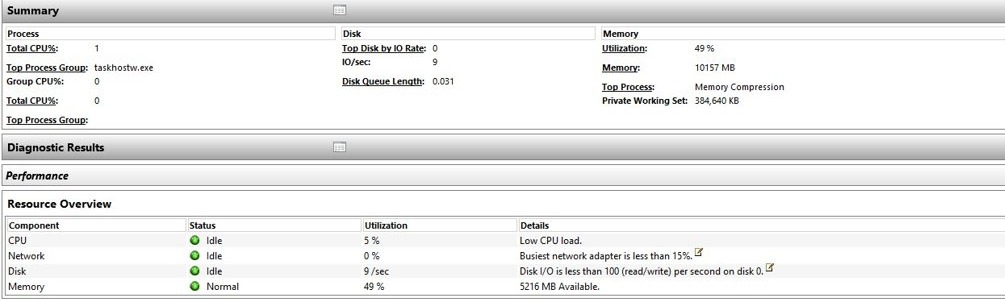
What to look for in the report: read the warnings first, because they name the driver, service or hardware problem directly. Then check the resource summary for CPU, network, disk and memory, and match anything flagged to the interpreting table below.
Testing RAM with Windows Memory Diagnostic (mdsched) — quick hardware triage
When to run the RAM test: run it after random restarts, blue screens such as IRQL_NOT_LESS_OR_EQUAL, or apps that crash with no pattern. Save your work first, because the test runs after a restart.
- Press Windows key + R, type
mdschedand select OK. - Select Restart now and check for problems (recommended).
- Let the Standard test run. For a deeper pass, press F1, set Test Mix to Extended with the arrow keys and press F10.
- Sign in after the PC restarts and wait a few minutes for the result notification.
Reading results from Windows Memory Diagnostic
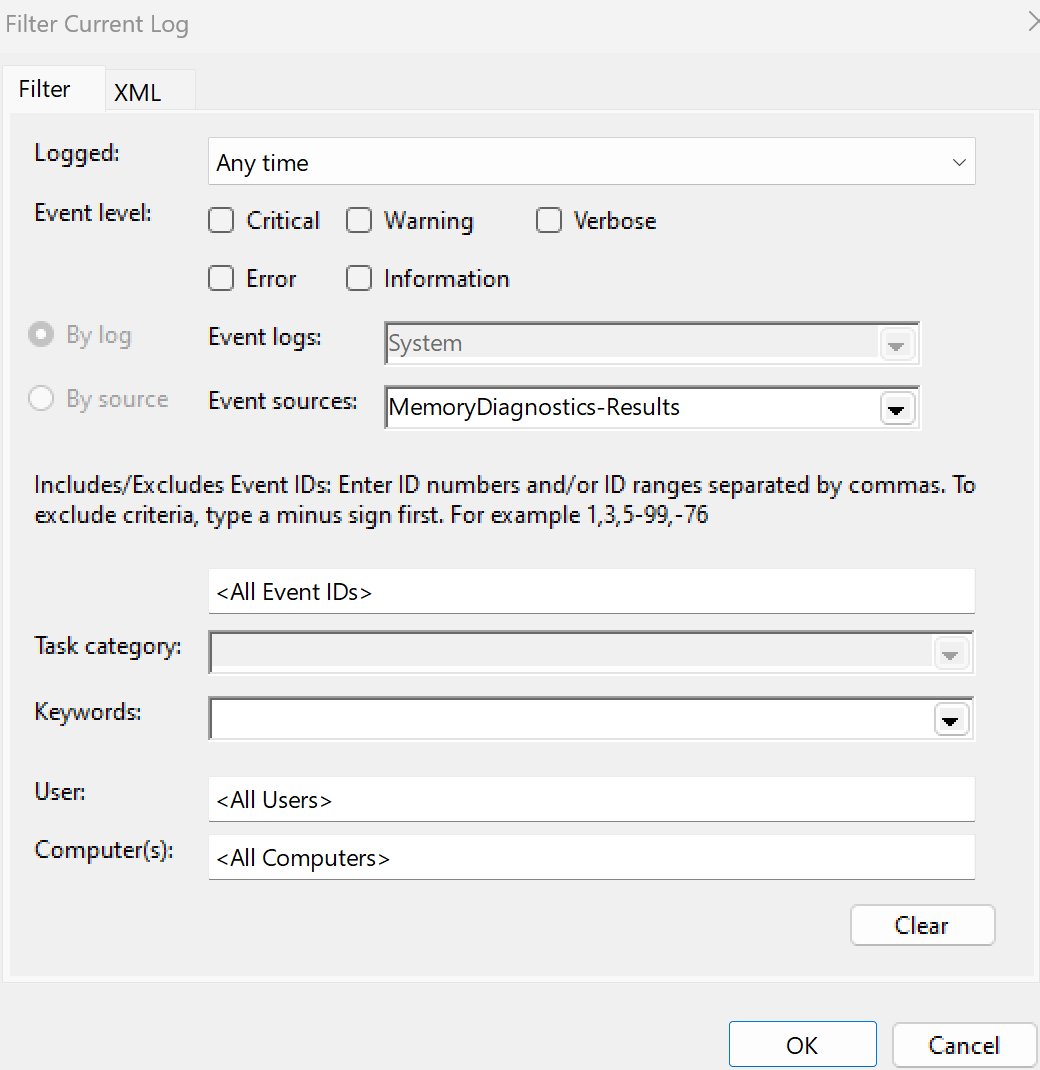
- Right-click Start and select Event Viewer.
- Go to Application and Services Logs > Microsoft > Windows > MemoryDiagnostics-Results > Debug.
- Select the newest event to see that test run.
- Event ID 2001 means no memory errors were detected; any reported error points to a failing memory module.
Using winsat (built into Windows)
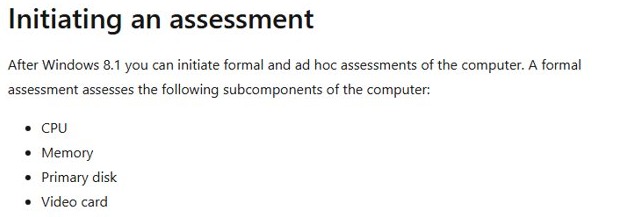
WinSAT, the Windows System Assessment Tool, still ships with Windows but Microsoft marks it as possibly altered for releases after Windows 8.1. A formal assessment scores the CPU, memory, primary disk and video card, and cannot run on battery power.
winsat formalRun in Command Prompt opened as administrator with the laptop plugged in. It runs the full assessment and saves the scores. Afterwards, read them in PowerShell with Get-CimInstance Win32_WinSAT.
You should see: Get-CimInstance Win32_WinSAT lists CPUScore, MemoryScore, DiskScore, GraphicsScore and WinSPRLevel, the base score. WinSATAssessmentState 1 means the result is valid.
The base score equals the lowest subscore, not an average, so it names the weakest component. For memory bandwidth only, winsat mem runs a single test from an elevated prompt.
Test disk speed with winsat and disk benchmarks
The WinSAT DiskScore measures sequential read throughput on the primary disk. It does not show random 4K speed, which is what makes a PC feel slow when it boots or opens apps.
- Plug in the PC and close other apps.
- Run
winsat formalfrom an elevated Command Prompt. - Open PowerShell and run
Get-CimInstance Win32_WinSATto read DiskScore. - For sequential and random read and write figures, use a dedicated disk benchmark from its developer's own site.
- Compare the results with the rated speeds on the drive maker's product page.
When to use CrystalDiskMark or MiniTool Partition Wizard: use a dedicated disk benchmark like these when you need random read/write numbers or want to test a second drive, which WinSAT does not score. What counts as good disk performance is the drive's own rated speed: an SSD running far below its specification, or a drive pinned at 100% in Task Manager while idle, needs attention.
Run benchmark software for comparable numeric scores
Why use third-party benchmarks: built-in tools tell you whether something is wrong, but not how the PC ranks against the same model elsewhere. A benchmark gives one repeatable number you can compare.
- Download the benchmark only from the developer's own website or the Microsoft Store.
- Plug in the laptop and set Settings > System > Power & battery > Power mode to the mode you want to measure.
- Close background apps and wait for Windows Update to finish.
- Run the benchmark three times and record the median score.
- Compare against results for the same CPU or GPU, not a different model.
How to run benchmarks responsibly: change one thing at a time between runs, keep the room temperature similar, and never judge a PC on a single run.
Manufacturer diagnostic utilities — use vendor tools for firmware and health checks
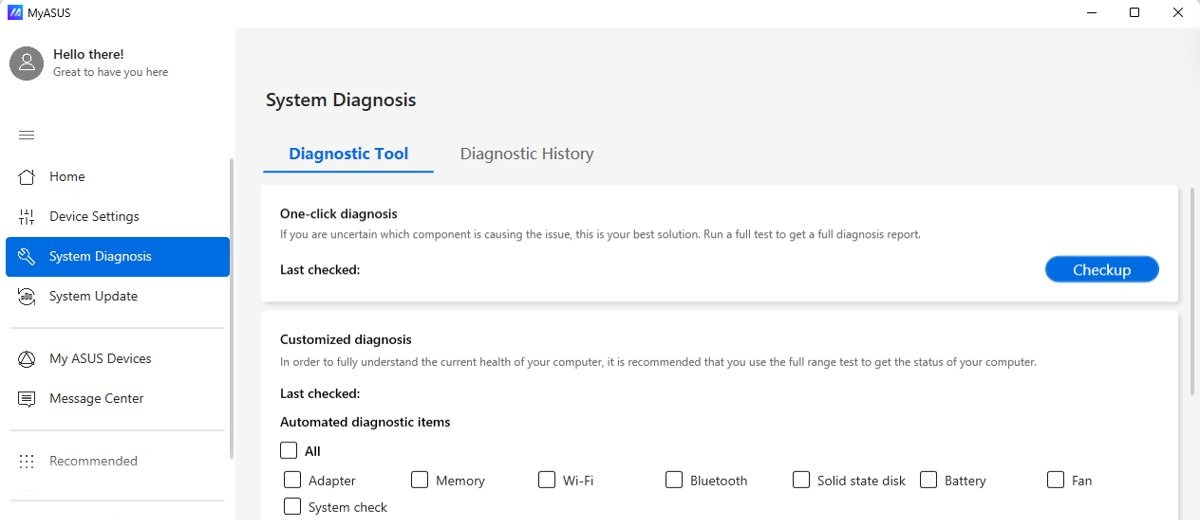
Windows tools cannot read every vendor's battery, fan or drive health data, and they do not update firmware. The PC or drive maker's own diagnostic app does both.
- Find your PC model and serial number on the label or in Settings > System > About.
- Open the support page on the PC maker's own website and enter the model.
- Install the maker's diagnostic or support app from that page.
- Run its hardware test and apply any BIOS, firmware or driver update it lists.
- For a separate SSD, use the drive maker's own utility to check health and firmware.
Interpreting results — a practical playbook
| Area | Healthy sign | Problem sign | Next step |
|---|---|---|---|
| CPU results | Usage drops when you stop working | Near 100% while idle, or one process holds it | End or update that app; scan with Windows Security |
| Memory results | In use stays below installed RAM | Memory near full and disk busy at the same time | Close apps, disable startup apps, or add RAM |
| Disk results | Short spikes, then idle | Disk at 100% for minutes; DiskScore low for an SSD | Free space, optimize drives, check drive health |
| GPU and gaming | GPU busy only in games and video | GPU low while the game stutters, or high at the desktop | Update the graphics driver; check Power mode |
| Report warnings | No red items in Resource Overview | Driver or service warnings in Diagnostic Results | Update or reinstall the named driver |
Troubleshooting a slow Windows PC step by step
Work through this checklist one symptom at a time, testing again after each fix so you know which change helped.
CPU is high while the PC is idle
A background app, update or malware keeps the processor busy.
- Sort Task Manager Processes by CPU.
- Close or uninstall the app responsible.
- Run Settings > Privacy & security > Windows Security > Virus & threat protection > Quick scan.
Disk is at 100% and apps open slowly
Low free space or a heavy background task.
- Open Settings > System > Storage > Temporary files and select Remove files.
- Search Defragment and Optimize Drives, select the drive and select Optimize.
- Restart from Start > Power > Restart.
Random restarts or blue screens
Faulty RAM or a bad driver.
- Run
mdschedand check MemoryDiagnostics-Results in Event Viewer. - Open Settings > Windows Update > Advanced options > Optional updates for driver updates.
- Run
perfmon /relto see which crash started when.
Safety, risks, and caveats
| Risk | Why | Safe practice |
|---|---|---|
| Unsaved work lost | mdsched restarts the PC | Save and close everything first |
| Heat during stress tests | Benchmarks run hardware at full load | Stop if the fan or temperature becomes extreme |
| Fake benchmark downloads | Download portals bundle unwanted software | Download only from the developer's own site or the Microsoft Store |
| Misleading scores | Battery mode, updates and heat lower results | Plug in, wait for updates, repeat runs |
| Firmware updates | An interrupted update can stop the PC booting | Use the maker's tool on AC power and do not interrupt it |
Advanced tips and best practices
| Tip | How |
|---|---|
| Save a baseline | Run perfmon /report and winsat formal when the PC is healthy and keep the numbers |
| Test the same power mode each time | Settings > System > Power & battery > Power mode |
| Use Resource Monitor for detail | perfmon /res shows which file or process the disk is busy with |
| Check stability history | perfmon /rel shows app failures and Windows errors by day |
| Adjust visual effects on older hardware | Search Adjust the appearance and performance of Windows > Visual Effects > Adjust for best performance |
When to escalate — hardware replacement vs software fixes
Fix software first: startup apps, background processes, drivers, updates and free disk space. Replace hardware only when a built-in test proves a fault or a limit. Memory Diagnostic errors mean replacing the memory module, a drive failing its maker's health test means replacing the drive, and memory that stays full during normal work means adding RAM. Everything else in a slow PC is usually software.
Practical examples — short workflows
| Workflow | Steps |
|---|---|
| Quick triage (5–10 minutes) | Open Task Manager, check the Performance graphs while the PC is slow, sort Processes, disable heavy startup apps, restart |
| Deep diagnostic (30–90 minutes) | Run perfmon /report, read the warnings, run mdsched with the Extended mix, run winsat formal, check perfmon /rel, then run the PC maker's diagnostics |
FAQs (concise answers)
How do I test my PC performance in Windows 11?
Open Task Manager with Ctrl + Shift + Esc and check the Performance tab, then run perfmon /report for a diagnostics report. For scores, run winsat formal as administrator and read them with Get-CimInstance Win32_WinSAT.
Does Windows 11 have a built-in benchmark?
Yes. WinSAT, the Windows System Assessment Tool, still runs from an elevated Command Prompt with winsat formal. It scores CPU, memory, disk and graphics, but Windows no longer shows the old Experience Index in Settings.
How do I check my Windows Experience Index score?
Run winsat formal in an administrator Command Prompt, then run Get-CimInstance Win32_WinSAT in PowerShell. WinSPRLevel is the base score, which equals the lowest of the component scores.
How long does Windows Memory Diagnostic take?
The time depends on the amount of RAM and the test mix. Standard is the default and shorter pass; the Extended mix, selected with F1, is more thorough and takes longer. The result appears as a notification after you sign in.
What does perfmon /report do?
It starts the System Diagnostics Data Collector Set, gathers system data and then displays a report of the results. The report flags driver, service and hardware problems and summarizes CPU, network, disk and memory use.
Can winsat run on a laptop on battery?
No. Microsoft states a formal WinSAT assessment cannot run on a computer running on batteries. Plug in the laptop before you run winsat formal.
Are third-party benchmarks safe?
They are safe when downloaded from the developer's own site or the Microsoft Store. Avoid download portals, watch temperatures during stress tests, and save your work before you start.