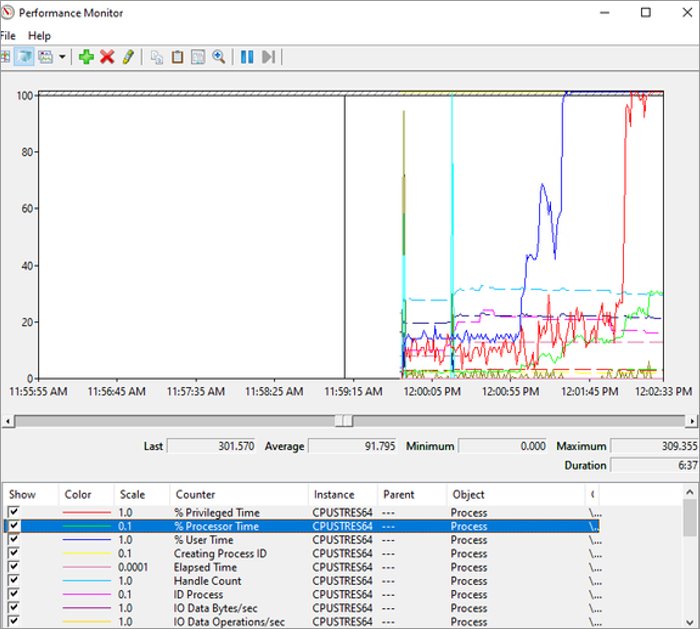
Press Windows key + R, type perfmon and select OK to open Performance Monitor in Windows 11, then select Monitoring Tools > Performance Monitor to graph live CPU, memory, disk and network counters.
The sections below cover adding counters, logging them to a file with a data collector set or logman, the perfmon /report, /rel and /res switches, and fixes for missing counters, stuck reports and perfmon.exe high CPU.
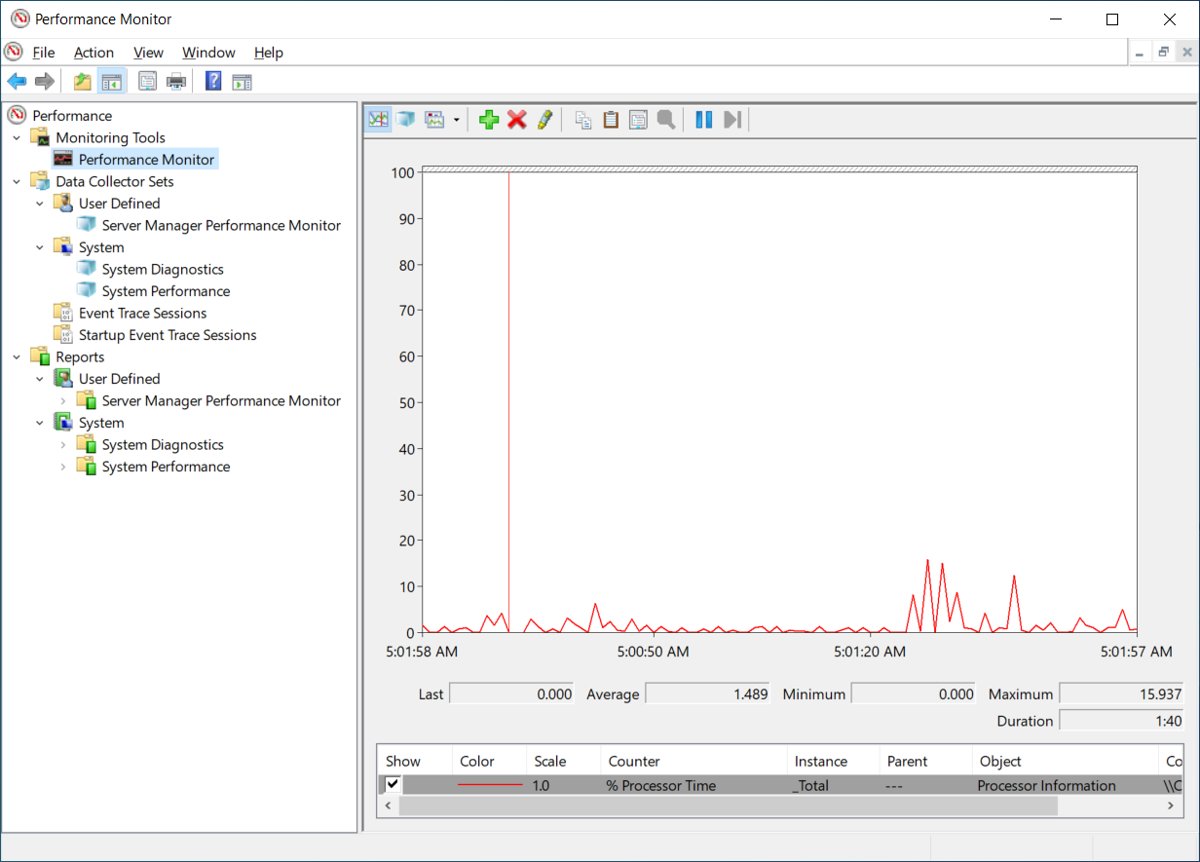
How to open Performance Monitor in Windows 11
Performance Monitor is built into Windows 11 and Windows 10, so there is nothing to download or install.
- Press Windows key + R to open the Run dialog.
- Type
perfmonand select OK. - In the left pane, expand Monitoring Tools and select Performance Monitor.
- Watch the graph on the right, which takes a new reading once a second by default.
You can also type perfmon or Performance Monitor into Windows Search and select the result. Typing perfmon /sys in the Run box or Command Prompt opens Performance Monitor in its own window.
Live data needs an administrator account or membership in the Performance Monitor Users group. A standard account can still open saved logs, but it cannot view real-time data.
What is the Perfmon tool in Windows 11?
Perfmon is the Microsoft Management Console snap-in behind Windows Performance Monitor. It reads performance counters, which are measurements of system state or activity published by Windows and by installed apps.
| Part of Perfmon | What it does | Use it to |
|---|---|---|
| Monitoring Tools > Performance Monitor | Graphs the counters you add, live or from a saved log | Watch CPU, memory, disk or network load as it happens |
| Data Collector Sets > User Defined | Saved groups of performance counters, event traces and registry values that run on demand or on a schedule | Log data to a file while you are away, or raise an alert when a counter crosses a limit |
| Data Collector Sets > System | Sets that ship with Windows, including System Diagnostics | Get a ready-made health report without building anything |
| Reports | A report Windows builds every time a data collector set runs | Read the results of a logging session in one page |
Scheduled data collector sets run even while the Performance Monitor window is closed. Administrators can use every feature; members of Performance Log Users can also create and edit data collector sets.
How to use Performance Monitor in Windows 11/10
Performance Monitor graphs whatever counters you add. Each counter belongs to an object such as Processor, Memory, PhysicalDisk or Network Interface, and many objects split into instances, such as _Total or one per CPU core.
- Open Performance Monitor and select Monitoring Tools > Performance Monitor.
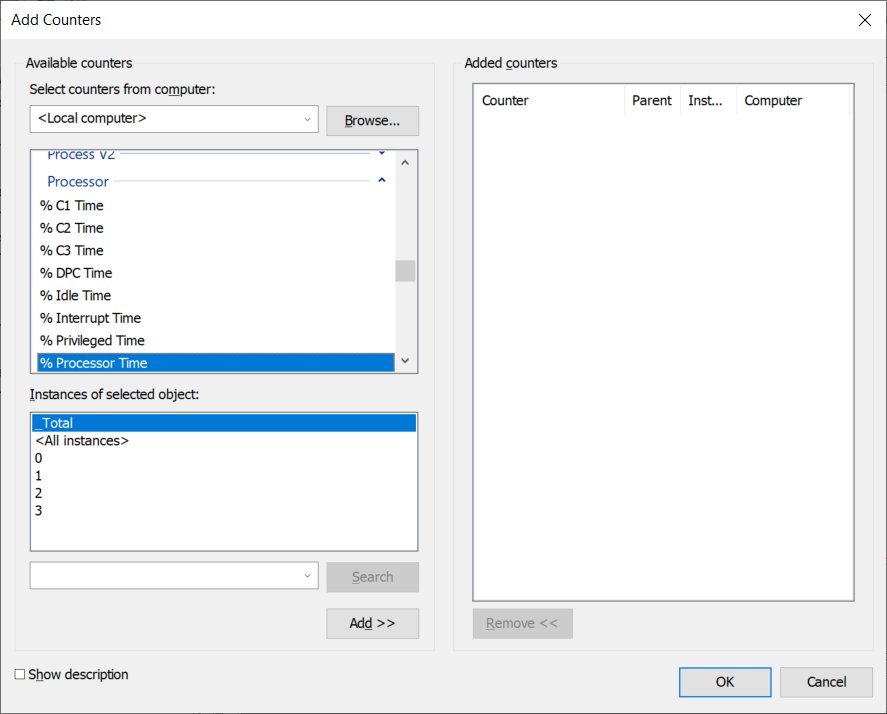
- Select the Add (+) button on the toolbar, or right-click the graph and select Add Counters.
- Keep the local computer selected in the drop-down at the top of the Add Counters dialog.
- Select the arrow next to an object, such as Processor, to list its counters; tick Show description to read what each one measures.
- Select a counter, such as % Processor Time, pick _Total under Instances of selected object, and select Add.
- Hold Ctrl while you click to pick several counters from one object before you select Add.
- Select OK to return to the graph and watch the new lines.
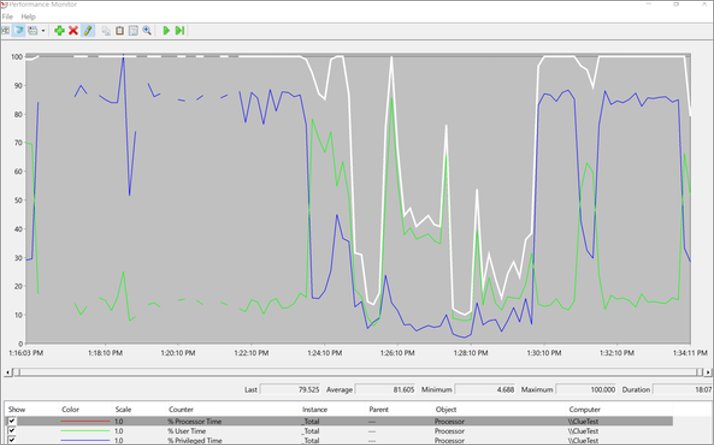
Right-click the graph and select Save Image As to keep a picture of it, or Save Settings As to save the current view as a web page. The toolbar also switches the same counters between a line graph, a histogram and a report.
How to change the Perfmon sample interval and duration
Performance Monitor reads every counter once a second unless you change it. A longer interval shows slow trends, such as memory that grows over several hours, on one screen.
- Right-click the graph and select Properties, or press Ctrl + Q.
- Open the General tab.
- In Sample every, enter the number of seconds between readings.
- In Duration, enter how many seconds of data the graph should span.
- Select Apply to preview the change, then select OK.
For example, 600 in Sample every and 86400 in Duration records one value every 10 minutes across 24 hours. The Data tab of the same dialog adds or removes counters, and the Source tab switches the graph from live data to a log file.
Common Perfmon counters for CPU, memory, disk and network
Start with these counters and the _Total instance, then add single cores, disks or processes once you know which resource is struggling.
| Counter | What it measures | Warning sign |
|---|---|---|
| Processor\% Processor Time | Share of time the CPU spends running non-idle threads | Above 85 percent for long periods |
| System\Processor Queue Length | Threads waiting for processor time | More than twice the number of CPUs for an extended period |
| Memory\Pages/sec | Pages read from or written to disk to resolve hard page faults | Above 1,000 from heavy paging, a possible memory leak |
| PhysicalDisk\% Disk Time | Share of the sample interval the disk was busy | Above 85 percent: the disk is saturated |
| PhysicalDisk\Avg. Disk Queue Length | Read and write requests waiting for the disk | More than twice the number of spindles |
| Network Interface\Bytes Total/sec | Bytes sent and received on each network adapter | More than 70 percent of the adapter's capacity |
| Network Interface\Output Queue Length | Packets waiting in the adapter's output queue | More than 2 |
On a PC with an SSD the disk queue counters matter less, because disk bottlenecks are unlikely there. When the CPU or memory counters stay in the warning range during normal use, reduce the workload or adjust Windows performance settings before you consider new hardware.
How to log Perfmon data to a file
A data collector set records counters to a log file, so you can capture a slowdown that happens while you are away from the PC. The quickest route saves the counters already on the graph.
- Add the counters you want to record to the Performance Monitor graph.
- Right-click the graph, point to New and select Data Collector Set.
- Enter a name for the set and select Next.
- Keep the default Root Directory or browse to the folder where the log should go, then select Next.
- Leave the Run as account at its default, which is the System account.
- Select Start this data collector set now, then select Finish.
- Find the set later under Data Collector Sets > User Defined.
If you type the folder path by hand, leave off the trailing backslash. Counter logs are saved in the binary .blg format by default, which Performance Monitor opens directly; stop a running set from an administrator Command Prompt with logman stop followed by its name.
How to configure Perfmon log options
Schedule and stop settings live in the data collector set's properties. A set with no stop condition keeps logging until you stop it.
- In Performance Monitor, expand Data Collector Sets and select User Defined.
- Right-click your set and select Properties.
- On the Schedule tab, select Add and set the start date, time and days; tick Expiration date if new runs should stop after a certain day.
- On the Stop Condition tab, tick Overall duration and choose a number and unit, such as 2 hours.
- To split a long session into several logs, tick When a limit is reached, restart the data collector set, then set Duration or Maximum Size.
- Select OK.
The overall duration must be longer than the sample interval, or the report has no data. An expiration date blocks new runs but does not stop one already in progress.
Running a set for 10 minutes every hour during the working day builds a baseline of normal use, so a later slowdown stands out against it.
How to open a Perfmon log file (.blg) in Performance Monitor
- Open Performance Monitor and select Monitoring Tools > Performance Monitor.
- Right-click the graph, select Properties and open the Source tab.
- Under Data source, select Log files, then select Add.
- Browse to the .blg file and select Open; select Add again to compare several logs on one graph.
- Select Time Range and drag the sliders to show only part of the log.
- Select OK, right-click the graph and select Add Counters.
- Pick the recorded counters you want to draw and select OK.
Only the counters stored in the log appear in Add Counters. For the summary instead of the raw graph, expand Reports > User Defined, expand your set and select a report.
How to create a Perfmon log from the command line with logman
logman builds a counter data collector from an administrator Command Prompt, which helps when you repeat the same capture on several PCs.
logman create counter perf_log -c "\Processor(_Total)\% Processor Time" -si 00:00:15 -rf 01:00:00Creates a counter data collector named perf_log that reads total CPU time every 15 seconds and runs for one hour once started.
You should see: logman reports that the command completed; logman start perf_log begins the capture, and logman query perf_log shows the collector's settings.
Add more counter paths after -c, each in quotes, or list them one per line in a text file and pass it with -cf. Use -f csv for a CSV log, and logman stop perf_log ends the capture early.
For a quick CPU usage check with no data collector set, typeperf "\Processor(_Total)\% Processor Time" prints the counter in the Command Prompt window once a second until you press Ctrl + C. Add -o cpu.csv to write the readings to a CSV file instead.
How to convert a Perfmon .blg log to CSV with relog
relog copies the counters from a binary .blg log into CSV, TSV or SQL, so you can open the readings in Excel.
relog perf_log.blg -f csv -o perf_log.csvReads every counter from perf_log.blg in the current folder and writes them to perf_log.csv in comma-separated format.
You should see: perf_log.csv appears next to the original log and opens in Excel.
Add -t 30 to keep only every 30th reading, or use -b and -e with times in M/D/YYYY HH:MM:SS format to copy one time window. relog perf_log.blg -q lists the counters and the time range a log holds.
perfmon /report command
perfmon /report runs the built-in System Diagnostics data collector set, then shows a report on hardware resources, system response times, processes and configuration, with suggestions to improve responsiveness.
perfmon /reportStarts the System Diagnostics data collector set and displays a report of the results when collection ends.
You should see: The window shows the collection progress first, then the finished System Diagnostics report.
Run it from Command Prompt opened as administrator. perfmon /report "Set name" builds a fresh report for one of your own data collector sets, and earlier System Diagnostics reports stay under Reports > System.
What is perfmon /rel and perfmon /res?
perfmon.exe takes four switches, and each opens a different part of Windows' monitoring tools in its own window.
| Command | Opens | Use it to |
|---|---|---|
| perfmon | The full Performance Monitor console | Graph counters, build data collector sets and read reports |
| perfmon /sys | Performance Monitor alone, in its own window | Keep a live graph open without the rest of the console |
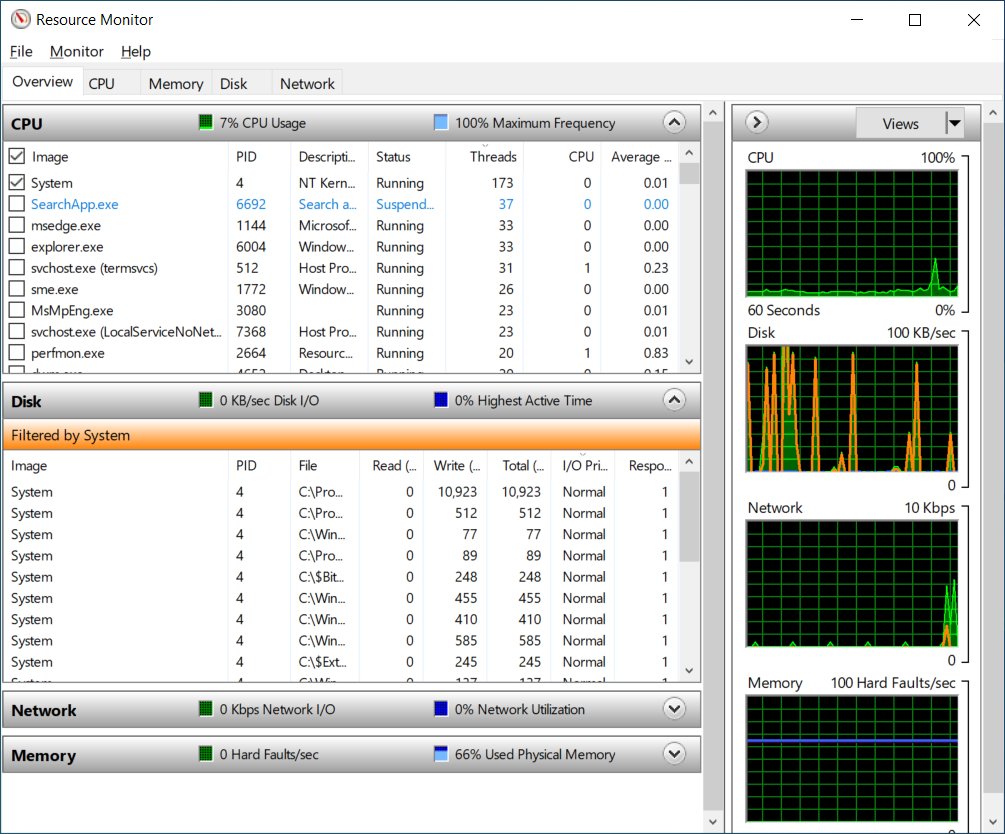
| perfmon /res | Resource Monitor (Resource View) | See which process is using CPU, disk, network or memory right now |
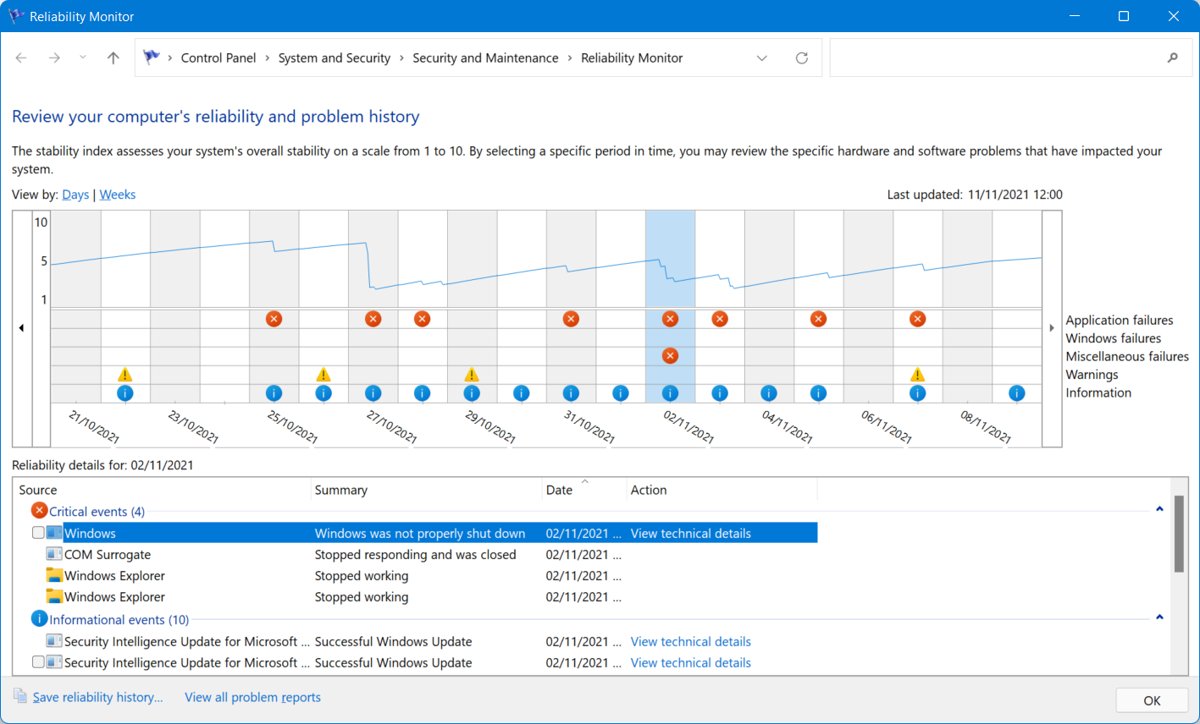
| perfmon /rel | Reliability Monitor | Read the 1-10 stability index and the app and Windows failures behind it |
| perfmon /report | The System Diagnostics report | Get a one-page health check of the PC |
Reliability Monitor also opens from Control Panel: select Security and Maintenance > Maintenance > View reliability history. In Resource Monitor, ticking a process's check box keeps it highlighted on every tab.
How to find a memory leak with Perfmon
Perfmon cannot tell you which code leaks memory, but it shows whether memory use climbs steadily over hours.
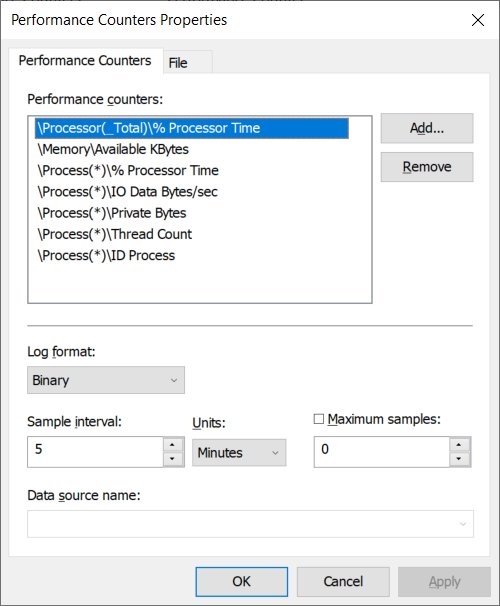
- Open Performance Monitor, right-click Performance Monitor under Monitoring Tools and select Properties.
- On the Data tab, add Memory > Pool Nonpaged Bytes, Memory > Pool Paged Bytes and Paging File > % Usage.
- On the General tab, set Sample every to 600 seconds and Duration to 86400 to cover 24 hours.
- Select OK, start the app you suspect and leave the PC alone.
- Check the graph after several hours, because the values swing at first and leaks build slowly.
- Read the trend: Pool Paged Bytes and Paging File % Usage climbing together points to a user-mode leak, while a rising Pool Nonpaged Bytes points to a kernel-mode leak.
Kernel-mode counters occasionally rise because an app is caching data, so confirm a climb over a long run. If Paging File % Usage stays high without a steady climb, change the virtual memory settings in Performance Options.
How to monitor a remote computer with Performance Monitor
- On the remote PC, allow the Performance Logs and Alerts exception in Windows Defender Firewall.
- Open Performance Monitor on your own PC.
- Right-click the top entry in the left pane and select Connect to another computer.
- Type the remote computer's name, or select Browse to pick it from a list, then select OK.
- Add counters as usual; every reading now comes from the remote PC.
Your account needs at least Performance Log Users membership on the remote PC, and members of that group also need Event Log Readers membership there. To mix counters from several PCs on one graph, pick each computer in the drop-down at the top of Add Counters instead.
Perfmon report not finishing or perfmon /report doesn't work
Perfmon report not finishing
Windows builds the report only after collection stops, and large logs take longer to process.
- Leave the window open while the set runs; the console shows how long the set is configured to collect.
- Wait for the working icon to clear after collection stops, because report generation starts only then.
- For your own sets, add an Overall duration on the Stop Condition tab that is longer than the sample interval.
- Split long sessions with When a limit is reached, restart the data collector set, or cut an existing log to one time window with
relogand its-band-eoptions.
perfmon /report doesn't work
Starting a data collector set needs administrator rights or Performance Log Users membership, and the Performance Logs and Alerts service must be running.
- Select Start, type cmd, right-click Command Prompt and select Run as administrator.
- Run
perfmon /reportagain from that window. - If it still fails, open PowerShell as administrator and run
Get-Service -Name pla | Restart-Serviceto restart the Performance Logs and Alerts service. - Run
perfmon /reportonce more.
Perfmon counters missing or showing no data
The performance counter libraries are damaged or disabled, which happens when some extensible counters or WMI-based programs change the registry.
- Open Command Prompt as administrator.
- Run
cd c:\windows\system32, thenlodctr /R. - Run
cd c:\windows\sysWOW64, thenlodctr /Ragain. - Run
winmgmt /resyncperfto resync the counters with WMI. - In PowerShell as administrator, run
Get-Service -Name pla | Restart-ServiceandGet-Service -Name winmgmt | Restart-Service -Force. - Create a new data collector set instead of reusing an old one.
How do I fix Performance Monitor (perfmon.exe) high CPU usage?
Performance Monitor reads every counter on the graph at each sample, so the work grows with the number of counters, the number of instances and how often it samples.
perfmon.exe uses a lot of CPU while the window is open
Too many counters or instances are sampled every second.
- Press Ctrl + Q in Performance Monitor and open the Data tab.
- Remove counters you no longer need, and replace <All instances> with the _Total instance.
- On the General tab, raise Sample every from 1 to 5 seconds or more.
- Select OK and watch perfmon.exe in Task Manager for a minute.
Logging continues after Performance Monitor is closed
A scheduled or running data collector set keeps collecting whether or not the window is open.
- Open Command Prompt as administrator and run
logman queryto list the data collector sets on the PC. - Stop a set that should not be running with
logman stopfollowed by its name. - In Performance Monitor, open that set's Properties and remove or change its entries on the Schedule tab.
- Select OK.
If perfmon.exe stays busy with only a few counters on the graph, rebuild the counter libraries with the lodctr /R steps above.
Perfmon FAQ
How do I use Perfmon in Windows 11?
Press Windows key + R, type perfmon and select OK, then select Monitoring Tools > Performance Monitor. Use the Add (+) button to pick counters such as Processor % Processor Time, and save the view as a data collector set to log it to a file.
What is the Perfmon tool?
Perfmon is Windows Performance Monitor, a Microsoft Management Console snap-in built into Windows. It shows performance counters live or from logs, records them with data collector sets, raises alerts when counters cross a limit, and builds reports.
How do I run Perfmon?
Press Windows key + R, type perfmon and select OK, or type perfmon in Windows Search or Command Prompt. Add /sys to open only Performance Monitor, /res for Resource Monitor, /rel for Reliability Monitor or /report for the System Diagnostics report.
What is perfmon /rel?
perfmon /rel opens Reliability Monitor, which rates the PC's stability on a 1 to 10 index and lists the application failures, Windows failures, miscellaneous failures and warnings behind each day's score. It also opens from Control Panel > Security and Maintenance.
What does perfmon /res do?
perfmon /res opens Resource Monitor, which shows CPU, disk, network and memory use per process in real time. Ticking a process's check box keeps that process highlighted on every tab, so you can follow one app across all four resources.
Is there a Perfmon download for Windows?
No. Performance Monitor ships with Windows 11, Windows 10 and Windows Server, so there is nothing to download. Run perfmon from the Run dialog instead of fetching a perfmon.exe file from a download site.
What is perfmon.exe?
perfmon.exe is the Windows program that opens Performance Monitor, Resource Monitor, Reliability Monitor and the System Diagnostics report. The genuine file is part of Windows, and the switches /sys, /res, /rel and /report choose which tool it opens.
How do I log Perfmon data to a file?
Add the counters to the graph, right-click it and select New > Data Collector Set, name it, pick a folder and choose Start this data collector set now. From an administrator Command Prompt, logman create counter builds the same kind of log.
How do I see performance in Windows 11?
For live figures, open Performance Monitor with perfmon or Resource Monitor with perfmon /res. For a one-page summary of the PC's health, run perfmon /report from an administrator Command Prompt and read the System Diagnostics report.