Process Monitor (ProcMon) shows live file system, Registry, process, thread and network activity on Windows, and its filters cut that stream down to the few events behind a fault.
This guide covers setup, a clean capture, filter technique, boot logging, log analysis and the command-line switches for unattended traces.
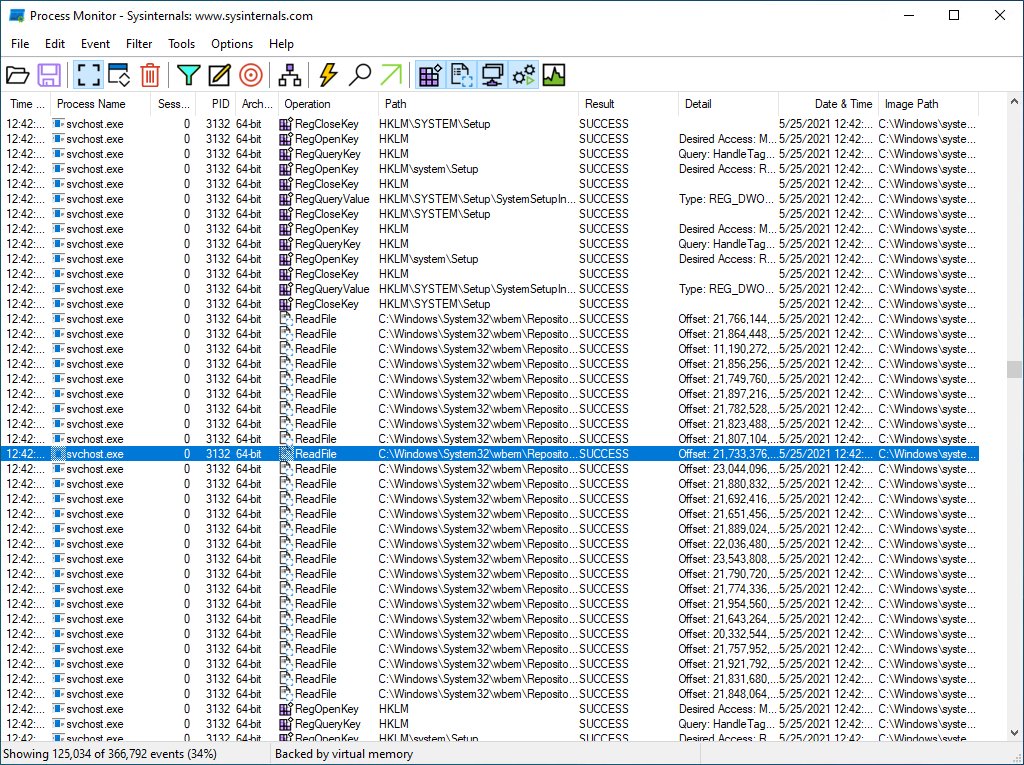
The fastest way to capture a ProcMon trace
Process Monitor begins capturing the moment it opens, so the first job is to stop it and clear the noise.
- Extract the Process Monitor download, right-click Procmon64.exe and select Run as administrator.
- Select Agree on the Process Monitor License Agreement the first time it runs.
- Press Ctrl + E to stop the capture that started automatically.
- Press Ctrl + X to clear the events already on screen.
- Select the Filter icon, add a filter for the process you are chasing, then select Apply and OK.
- Press Ctrl + E again, reproduce the problem, then press Ctrl + E to stop.
- Select File > Save, choose All events and Native Process Monitor Format (PML), then select OK.
A reader who stops here has a shareable trace. The sections below make that trace small enough to read.
What ProcMon Is and When to Use It
Process Monitor is a Sysinternals monitoring tool from Microsoft. It combines the two retired utilities Filemon and Regmon and adds non-destructive filtering on top.
| What it shows | What that looks like | Reach for it when |
|---|---|---|
| File system activity | Every file operation with the process that made it and the result returned | An install, a save or a launch fails and no log explains why |
| Registry activity | Key and value operations attributed to a process and user | A setting reverts on its own, or an app reads configuration from the wrong place |
| Process and thread activity | Process Create, Process Exit and Thread Exit events with exit codes | An application starts and disappears with no error dialog |
| Network activity | Network operations attributed to the owning process | You need the process behind a connection, not the contents of it |
| Thread stacks | A full stack per operation with integrated symbol support | The failing call has to be traced back to the component that made it |
| Process details | Image path, command line, user and session ID per event | Two copies of the same executable behave differently |
Version 4.11 runs on Windows 11 and higher on the client side, and Windows Server 2019 and higher on servers. Its logging architecture scales to tens of millions of events and gigabytes of log data.
A Linux build exists separately on GitHub, and Sysinternals Live can run the Windows tool without a local copy.
Downloading, Launching, and Configuring ProcMon
Process Monitor ships as a zip with no installer. Version 4.11 is a 3.1 MB download published on 10 September 2026.
- Open the Process Monitor page on Microsoft Learn and select Download Process Monitor.
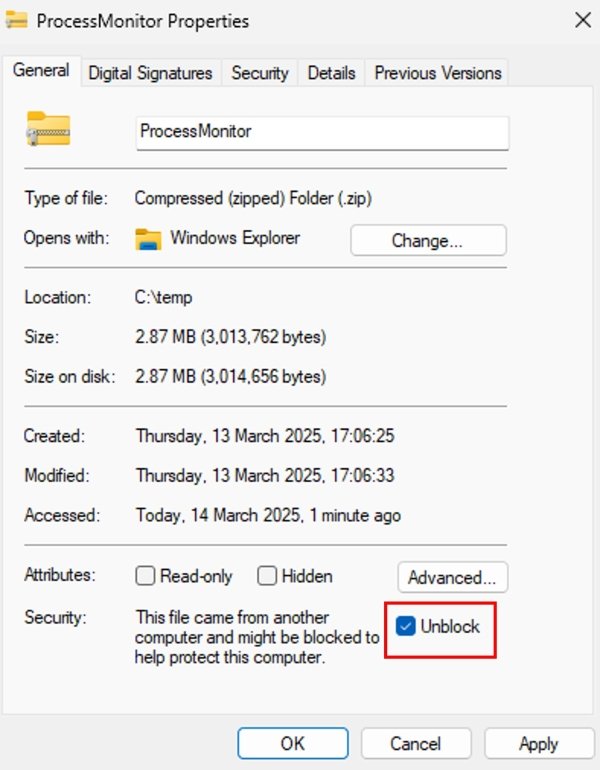
- Right-click the downloaded zip and select Properties, then tick Unblock beside Security on the General tab and select Apply.
- Extract the archive to a short local path such as
C:\Sysinternals. - Pick the binary that matches the platform: Procmon.exe on x86, Procmon64.exe on x64 and Procmon64a.exe on ARM.
- Right-click that binary and select Run as administrator, because a capture needs elevated permissions.
- Select Reset in the Process Monitor Filter dialog if a saved filter set appears, so no events are hidden by yesterday's work.
- Select File > Backing files and choose Use file named, pointing it at a drive with free space.
The Process Monitor download page for Windows 11 and 10 tracks the current build if you want the release details before fetching it.
Understanding ProcMon Events, Columns, and Activity Types
Four activity toggles sit on the toolbar. Turn one off and those events stop arriving; turn it back on and they resume.
| Activity type | Toolbar toggle | What it records | What it answers |
|---|---|---|---|
| File system | File System | File operations per process, with the result code for each | Which file a process was working on when it failed |
| Registry | Registry | Key and value operations per process | Which key a setting was read from or written to |
| Process and thread | Process/Thread | Process Create, Process Exit and Thread Exit events | Whether the process started at all, and how it ended |
| Network | Network | Network operations attributed to the owning process | Which process opened the connection |
Columns are configurable and moveable, and a filter can be set on any data field, including fields not shown as a column.
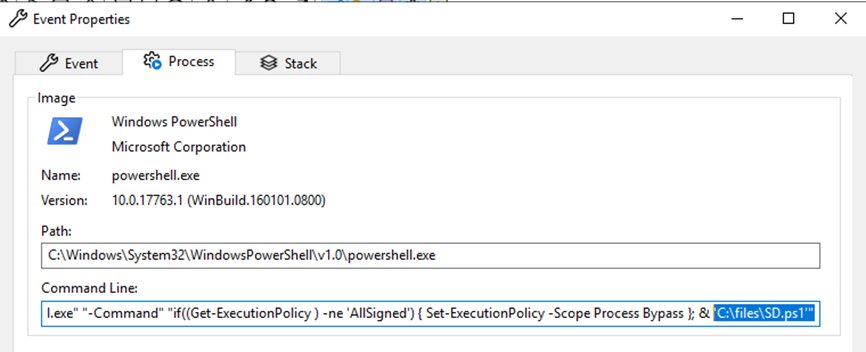
Double-click any row to open its properties. The Process tab carries the image path and the Command Line field, which often names the script or switch behind the event.
Capturing System Activity Step by Step
A useful capture is short. Close everything unrelated to the fault first, so the trace holds one story instead of twenty.
- Close applications that have nothing to do with the problem you are reproducing.
- Start Procmon64.exe as an administrator and press Ctrl + E to stop the automatic capture.
- Select Edit > Clear Display to empty the window.
- Confirm that File System, Registry, Process/Thread and Network are enabled on the toolbar for a first, wide capture.
- Shrink the Process Monitor window so the capture control stays reachable while the failing app has focus.
- Press Ctrl + E, reproduce the fault, and note the time it happened.
- Press Ctrl + E to stop as soon as the fault appears; two to four minutes covers a high CPU reproduction.
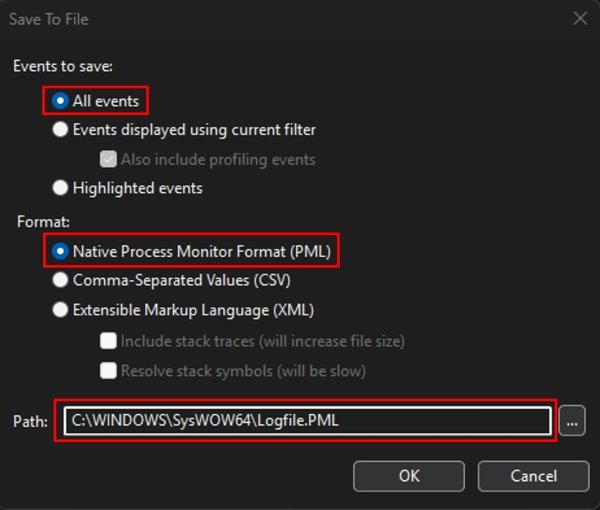
- Select File > Save, choose All events and Native Process Monitor Format (PML), then select OK.
Name the file so it identifies itself in a support thread later, for example PCNAME_LogFile_09222026_Repro_of_issue.PML.
Using Filters to Find Relevant Process, Registry, File, and Network Events
Filters here are non-destructive. Events removed from view stay in the log, so a filter can be widened again without recapturing.
- Select Filter > Filter to open the Process Monitor Filter dialog.
- Choose the field to match in the first list, such as Process Name, Operation, Path or Result.
- Leave the condition on is and type the value, for example
Process Createagainst the Operation field. - Select Add, repeat for each condition you want, then select Apply and OK.
- Right-click any row in the trace and select Add process to Include filter to narrow to that process without typing its name.
- Select Filter > Reset Filter when a filter hides too much, which restores the default set without losing data.
- Select File > Export Configuration and save a
.pmcfile to reuse the same filter set on another machine.
A saved .pmc file is what makes long unattended captures practical, because the command line can load it at launch.
Which filter to set first for your symptom
| Your situation | Set this filter | Why |
|---|---|---|
| An app starts and vanishes | Operation is Process Create, plus Operation is Process Exit | Shows whether the process ever ran and how it ended |
| A permissions problem is suspected | Result is ACCESS DENIED | Lists every refused operation in one pass, file and Registry together |
| One process is already the suspect | Right-click its row and select Add process to Include filter | Narrows to that process without typing anything |
| A file appears somewhere unexpected | Path set to the folder you are watching | Keeps file system events for a single tree |
| A Registry setting keeps reverting | Registry on the toolbar, the other activity types off | Removes file and network traffic from a Registry question |
| An unknown process is on the network | Network on the toolbar, the other activity types off | Attributes each connection to its owning process |
| The filter is now hiding the answer | Filter > Reset Filter, then rebuild it | Filtering never discards events, so nothing was lost |
Run ProcMon from Command Prompt or PowerShell
Console access is enough to trace a machine with no usable desktop. Switches work with a leading dash or a leading slash.
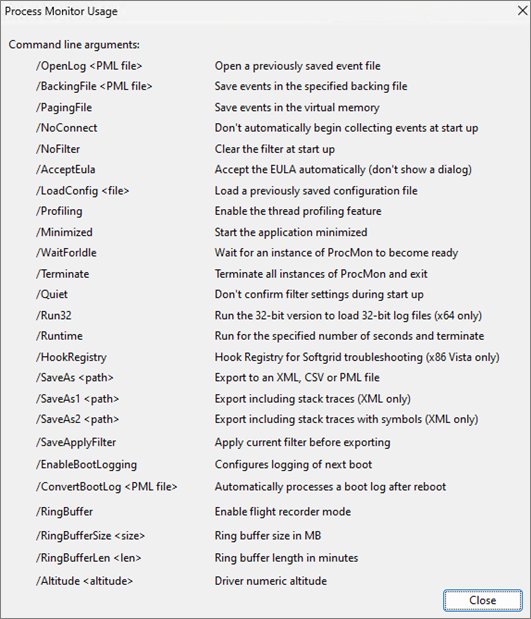
procmon64.exe -accepteula -backingfile C:\Sysinternals\Recording.pml -quiet -minimized-accepteula clears the licence prompt, -backingfile writes the trace straight to disk instead of virtual memory, -quiet suppresses the filter dialog at launch, and -minimized keeps the window out of the way. Stop and save the trace with procmon64.exe -terminate -quiet.
You should see: The PML file appears at the path you gave and grows while the capture runs.
Add /LoadConfig C:\Sysinternals\filter.pmc to start with an exported filter set, which is what keeps an unattended capture small. A maximum file size can be set as well.
PsExec drives the same command against another machine: psexec.exe -sd \\<Computer Name> C:\Sysinternals\procmon64.exe -accepteula -backingfile C:\Sysinternals\Recording.pml -quiet -minimized, and psexec.exe -sd \\<Computer Name> C:\Sysinternals\procmon64.exe -terminate -quiet stops it.
Both forms work inside a batch file, so a scheduled task triggered by an event ID can stop a trace at the moment a machine misbehaves.
Capture a boot log to see activity before sign-in
Boot time logging records operations from early in startup, long before Process Monitor could otherwise be running.
- Start Process Monitor as an administrator.
- Select Options > Enable Boot Logging.
- Restart the machine and let the fault happen during startup or sign-in.
- Sign in and launch Process Monitor again.
- Select Yes when it offers to save the boot log.
- Select File > Save, choose All events, then select OK.
On a machine that allows more than one session, a second route works: sign in as an administrator, start a capture, leave it minimized, then have the affected user sign in and reproduce the fault while the first session stays open.
How to check the capture worked
A trace that missed the fault wastes the next hour. Check these five things before closing the tool.
- Watch the status bar while capturing; the event count climbs as operations arrive.
- Confirm the Capture toolbar button shows a pause icon once you have stopped.
- Double-click the saved
.pmlfile to reopen it in Process Monitor. - Select Tools > Process Tree and confirm the process you were chasing is listed.
- Check that the event timestamps span the minute in which the fault happened.
Analyzing Results and Troubleshooting Common Windows Issues
Analysis runs backwards from the failure. Find the process first, then read the last operations before it gave up.
- Open the saved log and select Tools > Process Tree to see every process referenced in the trace.
- Select the failing process, right-click its name and select Add process to Include filter.
- Select OK to leave the tree and return to the filtered event list.
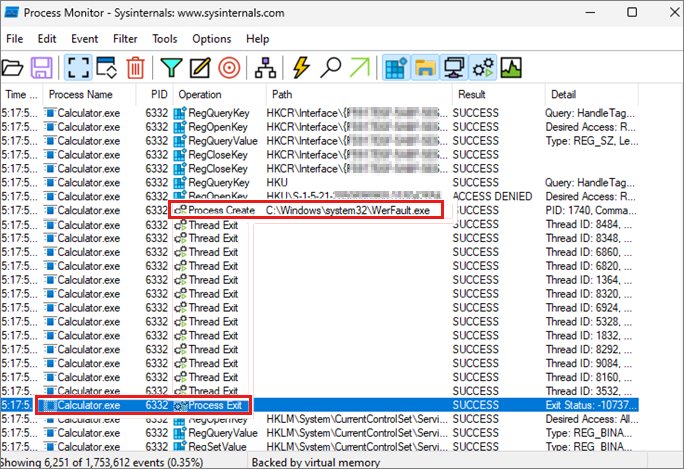
- Scroll to the end of that process's activity and look for a group of Thread Exit events immediately before Process Exit.
- Check for a Process Create event for WerFault.exe, which means the application had already reached an unrecoverable state and called the default error handler.
- Work upwards from that point looking for ACCESS DENIED in the Result column.
- Select Filter > Reset Filter, then Tools > Count Occurrences, choose Result and select Count to tally every result code in the whole trace.
- Double-click the ACCESS DENIED line in that list to see those events, then compare permissions on the named file or key against a machine where the app works.
Not every refusal matters. Requests for Desired Access: All Access are routinely denied and usually harmless, so filter those out before drawing a conclusion.
In one documented Store app failure the cause was ALL APPLICATION PACKAGES missing read permission on HKEY_CURRENT_USER\Software\Microsoft\Windows\CurrentVersion\Explorer\User Shell Folders.
Process Monitor captures only part of a process's activity. If many machines share the fault, rebuild a clean one and add policies until it breaks again.
Best Practices for Saving Logs, Reducing Noise, and Avoiding Performance Impact
An unbounded capture is the one way Process Monitor can hurt the machine it is diagnosing.
| Goal | Do this | Why it matters |
|---|---|---|
| Keep the log small | Turn off the activity types the fault cannot involve before capturing | Fewer events mean a smaller file and a faster search later |
| Avoid exhausting memory | Select File > Backing files and choose Use file named | A capture backed by virtual memory can consume all available system virtual memory and leave the machine unresponsive |
| Avoid filling the disk | Set a maximum file size on the backing file | Without a limit, a long capture can consume all free disk space |
| Keep every event | Save with All events and Native Process Monitor Format (PML) | Saving only displayed events leaves an analyst without the data they need |
| Survive an exit | Back the capture with a file rather than virtual memory | A file-backed trace does not have to be saved manually before closing the tool |
| Make the log identifiable | Name it with the computer, the date and the fault reproduced | A support case usually holds several traces from several machines |
| Give yourself a baseline | Capture the same steps on a machine that works | Differences between two traces stand out faster than absolutes in one |
| Share it cleanly | Zip the .pml file before sending it |
The native format preserves all data for loading in another Process Monitor instance |
| Reset afterwards | Select File > Backing files and choose Use virtual memory | Leaves the tool ready for the next short capture |
Fix ProcMon when a capture goes wrong
The capture grows to gigabytes within minutes
All four activity types are on and no filter is set, so every operation on the machine is being recorded.
- Press Ctrl + E to stop capturing.
- Turn off the toolbar activity types the fault cannot involve.
- Select Filter > Filter and add a Process Name or Operation condition before starting again.
- Select File > Backing files, choose Use file named and set a maximum file size.
- Capture only the seconds around the reproduction rather than a whole working session.
Process Monitor will not start on Windows Server
It was launched without elevation, the wrong binary was used, or the build predates the supported floor.
- Right-click the binary and select Run as administrator.
- Use Procmon64.exe on x64 servers and Procmon64a.exe on ARM.
- Confirm the server runs Windows Server 2019 or higher, the supported floor for version 4.11.
- Unblock the zip before extracting: right-click it, select Properties, tick Unblock, then select Apply.
- Copy the extracted Procmon.exe onto the server you are troubleshooting and run it there rather than remotely.
The saved log holds fewer events than the capture showed
The save dialog kept only the displayed or highlighted events instead of everything recorded.
- Reopen the original capture if it is still loaded in the window.
- Select File > Save.
- Select All events rather than the displayed or highlighted options.
- Select Native Process Monitor Format (PML).
- Save again, reopen the file and check the event count in the status bar.
ACCESS DENIED appears everywhere but the app still works
Applications routinely ask for more access than they need, and those refusals are expected behaviour.
- Filter out events carrying Desired Access: All Access.
- Read only the denials that arrive immediately before the failure.
- Compare permissions on the named file or Registry key with a machine where the app works.
- Correct the permission on that specific object instead of granting broad access.
- Recapture the same steps and confirm the denial is gone.
Nothing was captured during startup or sign-in
Boot logging was never enabled, so Process Monitor was not running that early in the session.
- Start Process Monitor as an administrator.
- Select Options > Enable Boot Logging.
- Restart the machine and reproduce the fault.
- Sign in, launch Process Monitor and select Yes when it offers to save the boot log.
- Select File > Save, choose All events and select OK.
Frequently Asked Questions
How do you run ProcMon on Windows Server?
Extract the archive on the server, then right-click Procmon64.exe and select Run as administrator. Version 4.11 supports Windows Server 2019 and higher. For a console-only server, run procmon64.exe -accepteula -backingfile C:\Sysinternals\Recording.pml -quiet -minimized instead.
How do you install ProcMon on Windows?
There is no installer. Download the zip from the Sysinternals page on Microsoft Learn, unblock it in the file's Properties, extract it to a folder such as C:\Sysinternals, and run the binary that matches your platform as an administrator.
How do you start a capture in ProcMon?
Capture starts automatically when Process Monitor opens. Press Ctrl + E or select the Capture toolbar button to toggle it off and on, and press Ctrl + X to clear events already collected before you begin the real capture.
How do you open ProcMon without downloading it first?
The Sysinternals page offers Run now from Sysinternals Live, which launches the current version without keeping a local copy. A separate Process Monitor build for Linux is published on GitHub and is maintained independently of the Windows tool.
How do I stop ProcMon from capturing too much data?
Turn off the activity types the fault cannot involve, add a Process Name or Operation filter before capturing, and back the capture with a file that has a maximum size. Then capture only the seconds around the reproduction.
What filters should I use first when troubleshooting an application problem?
Filter on the application itself: right-click one of its rows and select Add process to Include filter. Then add Operation is Process Create and Operation is Process Exit to see whether it started and how it ended.
How can I find what file or registry key is causing an Access Denied error?
Select Tools > Count Occurrences, choose Result, select Count, then double-click the ACCESS DENIED entry. Ignore requests for Desired Access: All Access, and compare permissions on the remaining paths against a working machine.
Can ProcMon capture activity that happens during Windows startup or user logon?
Yes. Select Options > Enable Boot Logging, restart, then launch Process Monitor after signing in and select Yes to save the boot log. Save it with All events so nothing recorded during startup is discarded.
What is the best way to save and share a ProcMon log for troubleshooting?
Select File > Save, choose All events and Native Process Monitor Format (PML), then zip the file. PML preserves all captured data for loading in another Process Monitor instance, which a text export cannot do.
Which ProcMon executable should you run?
Match the binary to the platform: Procmon.exe on x86, Procmon64.exe on x64 and Procmon64a.exe on ARM. Running the wrong one is a common reason a capture refuses to start on a server or an ARM device.
Bottom Line
Set a filter and a backing file before you press capture, never after. Process Monitor records every file, Registry, process and network operation on the machine, so an unfiltered trace buries the five lines that explain the fault. Filter on the suspect process or operation first, reproduce the problem in seconds rather than minutes, and save with All events in PML format. The analysis then takes minutes instead of an afternoon.

![How to Update Microsoft Basic Display Adapter In Windows 11/10 [Tutorial]](https://techdows.com/wp-content/uploads/2026/09/Intel-Driver-Support-Assistant-download-page-with-the-Download-now-button-600x338.jpg)
![[Fixed!] Keyboard Arrow Keys Not Working in Excel (7 Fixes)](https://techdows.com/wp-content/uploads/2026/09/On-Screen-Keyboard-with-the-ScrLk-key-highlighted-in-red-600x331.jpg)