Wireshark is the best free network analyzer for most people, and Cisco Secure Network Analytics, FortiAnalyzer, Azure Network Watcher and IBM SevOne are the paid picks for business networks.
This list covers eight network analyzer tools, what each one actually inspects, what it costs, and how to pick the right size of tool for your network.
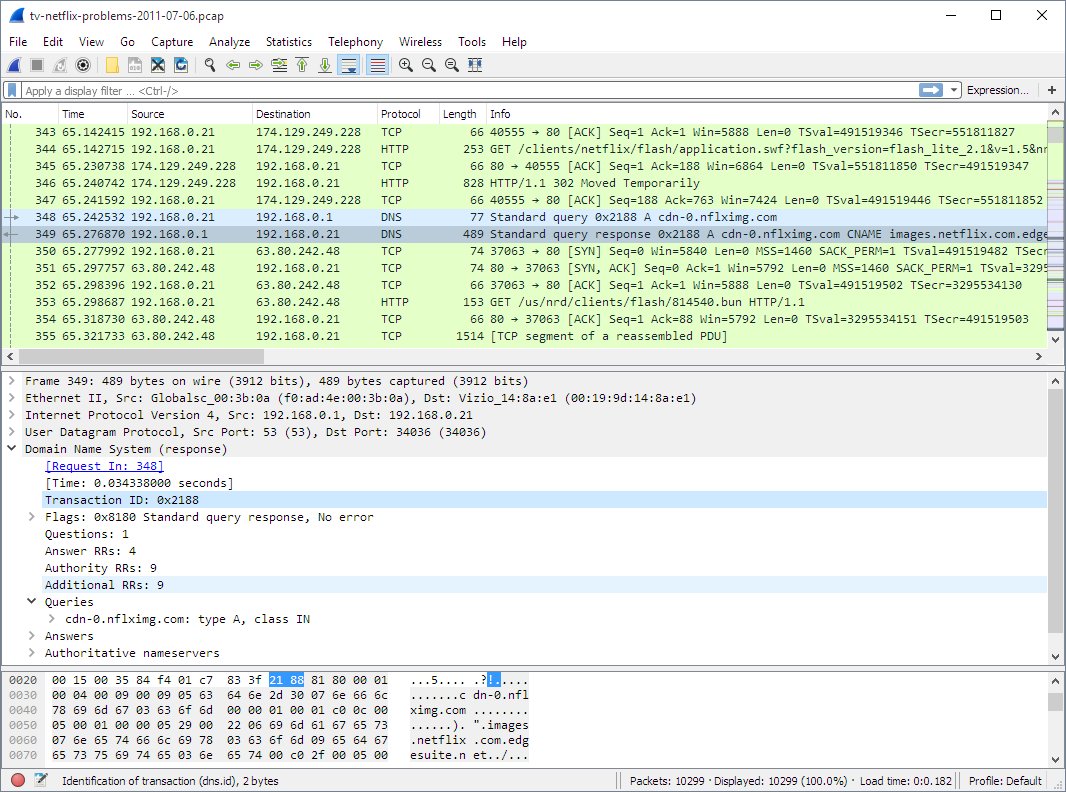
1. Wireshark (free)
Wireshark is a free, open source network protocol analyzer released under the GNU General Public License version 2.
It captures live packets and decodes hundreds of protocols on Windows, macOS, Linux and other systems. There is no paid edition and no demo limit.
- Download the Windows x64 or Arm64 installer, or the macOS Universal Disk Image, from the official Wireshark download page.
- Install it and open Wireshark.
- Double-click your active network interface on the welcome screen to start capturing.
- Type a display filter such as
dnsin the filter bar above the packet list and press Enter to show only matching packets. - Select a packet to see its decoded protocol layers in the middle pane.
- Choose Capture > Stop when you have enough data, then save the capture with File > Save.
You can download Wireshark for Windows 11 and Mac with the current version details. Captures save in pcapng and libpcap formats, and Wireshark also opens files from tcpdump, Microsoft Network Monitor and many older sniffers.
Choosing a network analyzer
Match your job to a row. The cheapest tool that answers your question is the right one.
| Your situation | Use this | Why |
|---|---|---|
| You need to read individual packets and protocols | Wireshark | Free, full protocol decoding and powerful display filters |
| You cannot install software on a Windows PC or server | Packet Monitor (pktmon) | Built into Windows 10, Windows 11 and Windows Server |
| You need to find every device and open port on a network | Nmap or Zenmap | Free host discovery, port scanning and OS detection |
| You want to see which app owns each connection on your PC | TCPView | Lists every TCP and UDP endpoint with its process name |
| You run a Cisco enterprise network and want threat detection from traffic | Cisco Secure Network Analytics | Behavioral analytics on network and cloud traffic |
| Your firewalls are FortiGate devices | FortiAnalyzer | Central logs, dashboards and SOC automation for the Fortinet Security Fabric |
| Your servers run in Azure | Azure Network Watcher | Flow logs, packet capture and connection tests for Azure resources |
| You manage a large hybrid or SD-WAN network | IBM SevOne | Network performance monitoring across clouds, containers and SD-WAN |
2. Microsoft Packet Monitor (pktmon, free)
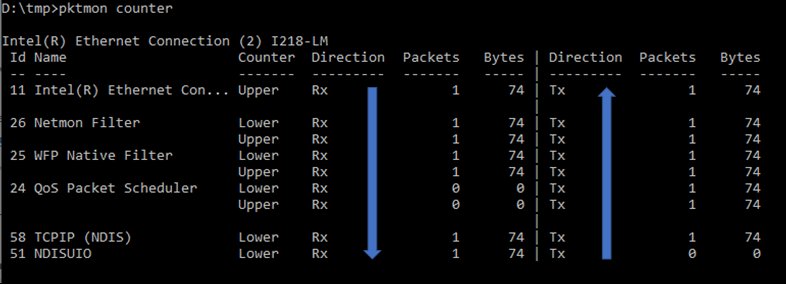
Packet Monitor is a network diagnostics tool built into Windows 10, Windows 11 and Windows Server 2019 and later. It captures packets, counts them and reports where they were dropped, with reasons such as MTU Mismatch or Filtered VLAN.
It runs from the pktmon command, so there is nothing to install.
- Open Command Prompt or Windows Terminal.
- Add a filter for the traffic you care about, for example
pktmon filter add -p 53for DNS traffic on port 53. - Start the capture with
pktmon start -c. - Reproduce the problem, then run
pktmon countersto confirm the expected traffic is flowing. - Stop the capture with
pktmon stop. - Convert the log to text with
pktmon etl2txt pktmon.etl, or convert it to pcapng and open it in Wireshark.
Packet Monitor supports up to 32 filters at once and can filter by MAC address, IP address, port, EtherType, transport protocol and VLAN ID. Windows Admin Center also offers a graphical Packet Monitoring extension.
3. Nmap and Zenmap (free)
Nmap is a free utility for network discovery and security auditing. It finds live hosts, the services and versions they run, their operating systems and the firewalls in front of them.
Zenmap is the official graphical front end, so beginners can run scans without memorising switches. You can download Nmap for Windows 11 and Mac with Zenmap included.
| What you want to do | Nmap or Zenmap fit | Note |
|---|---|---|
| Build an inventory of devices on your network | Good fit | Host discovery is Nmap's core job |
| Check which ports and services a server exposes | Good fit | Service and version detection report application names |
| Save scans and compare them over time | Zenmap | Saved results can be compared to see what changed |
| Read the contents of packets | Poor fit | Use Wireshark or Packet Monitor instead |
| Embed it in a commercial product | Needs a licence | The Nmap Public Source License requires the paid Nmap OEM Edition for that |
Official binary packages are available for Windows, macOS and Linux. Scan only networks you own or have written permission to test.
4. TCPView (free)
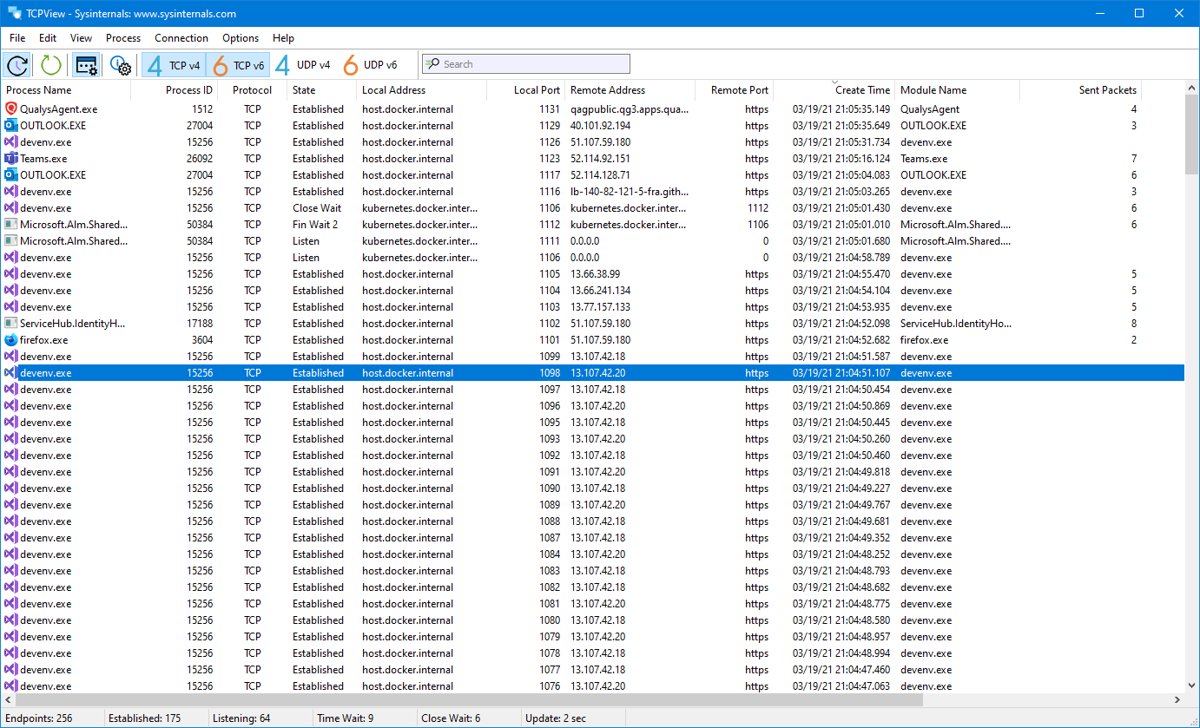
TCPView is a free Microsoft Sysinternals tool that lists every TCP and UDP endpoint on a Windows PC. It shows local and remote addresses, the connection state and the process that owns each endpoint.
It runs on Windows 8.1 and later and Windows Server 2012 and later.
- Download TCPView from its Microsoft Learn Sysinternals page and extract it.
- Run TCPView to list all active TCP and UDP endpoints with resolved names.
- Watch the highlights: new endpoints appear in green, changed ones in yellow and closed ones in red.
- Use Options > Refresh Rate to change the default one-second update.
- Right-click an ESTABLISHED connection and choose Close Connections to end it.
- Use the bundled
tcpvcon -a -ccommand when you need the same list as CSV.
5. Cisco Secure Network Analytics (paid)
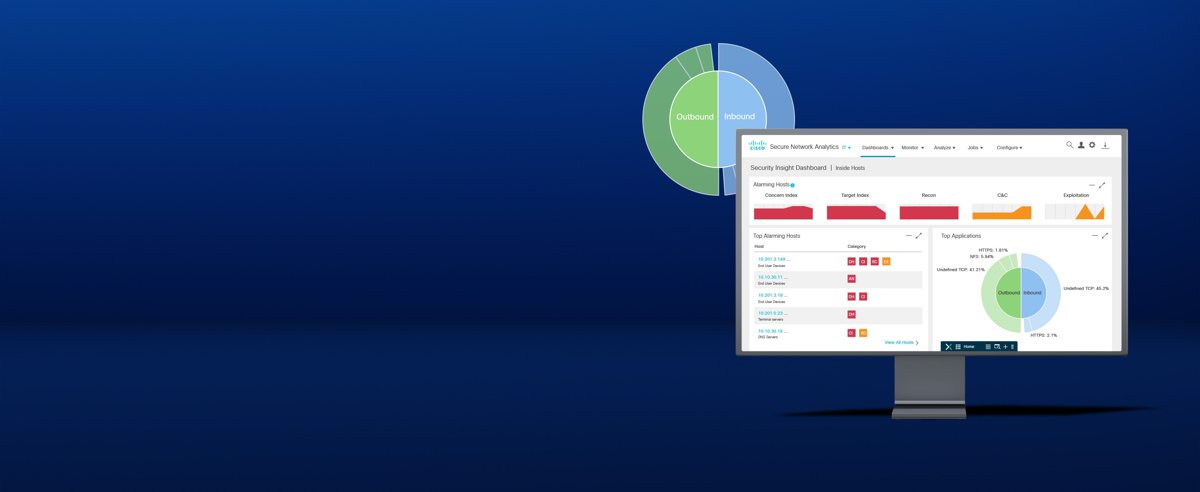
Cisco Secure Network Analytics, formerly Stealthwatch, turns existing network and cloud traffic data into threat detection. It uses machine learning and behavioral modeling to spot malware, insider threats and data exfiltration that got past other controls.
| Detail | Cisco Secure Network Analytics |
|---|---|
| Price | Paid; licensing is listed in Cisco's data sheet, with a self-guided demo |
| What it analyzes | Network and cloud traffic telemetry, plus firewall logs |
| Alert context | User, device, location, timestamp and application |
| Encrypted traffic | Identifies threats in encrypted traffic without compromising privacy or data integrity |
| Integrations | Cisco Identity Services Engine, Cisco XDR and Splunk |
| Best for | Security teams on Cisco enterprise networks |
6. Fortinet FortiAnalyzer (paid)
FortiAnalyzer collects logs and telemetry from networks, endpoints and cloud environments into one data lake. It is the analytics layer of the Fortinet Security Fabric, so it suits organisations already running FortiGate firewalls.
| Detail | FortiAnalyzer |
|---|---|
| Price | Paid, with a free product demo |
| Deployment | Hardware appliance, virtual machine or cloud |
| Dashboards | IoT, SOC, email metrics and endpoint vulnerability views |
| Threat intelligence | FortiGuard Labs outbreak detection and indicators of compromise |
| Automation | SIEM, SOAR and XDR functions, plus the FortiAI-Assist AI assistant |
| Best for | Fortinet networks that need central traffic logs and SOC reporting |
7. Azure Network Watcher (paid, with free monthly units)
Azure Network Watcher monitors and diagnoses the network health of Azure virtual machines, virtual networks, application gateways and load balancers. It is not built for PaaS monitoring or web analytics.
Network Watcher switches on automatically when you create a virtual network, and enabling it costs nothing. You pay for the checks, logs and tests you use beyond the free allowance.
| Feature | Free each month | Price after that |
|---|---|---|
| Virtual network flow logs collected | 5 GB | $0.50 per GB |
| Network diagnostic tools (IP flow verify, next hop, packet capture and others) | 1,000 checks | $0.001 per check |
| Connection monitor tests | 10 tests | From $0.30 per test per month |
| Traffic analytics | None listed | $2.30 per GB processed at 60-minute intervals, $3.50 at 10-minute intervals |
Prices are Microsoft's US estimates and vary by region. Network security group flow logs retire on September 30, 2027, so new setups should use virtual network flow logs.
8. IBM SevOne Network Performance Management (paid)
IBM SevOne is a network observability platform for hybrid networks across clouds, containers and SD-WAN. It ties network performance to the applications that depend on it.
| Detail | IBM SevOne |
|---|---|
| Price | Commercial; IBM offers a product tour and expert consultation, with no public price on the product page |
| Coverage | Hybrid cloud, enterprise Wi-Fi, SD-WAN and Cisco ACI software-defined networks |
| Focus | Application-centric network performance and automated actions |
| Integrations | IT operations tools through its ITOps integration features |
| Best for | Enterprises and managed service providers running large hybrid networks |
Best network analyzers highlights
This comparison of the top network analysis tools lists all eight network traffic analysis tools side by side on price, platform and the kind of data each one reads.
| Tool | Price | Platform | What it inspects | Who it suits |
|---|---|---|---|---|
| Wireshark | Free, open source (GPLv2) | Windows, macOS, Linux | Individual packets and protocols | Anyone troubleshooting or learning networks |
| Packet Monitor | Free, built in | Windows 10, Windows 11, Windows Server | Packets, counters and drops inside the Windows network stack | Windows admins on locked-down machines |
| Nmap and Zenmap | Free | Windows, macOS, Linux | Hosts, open ports, services and operating systems | Admins building an inventory or auditing exposure |
| TCPView | Free | Windows 8.1 and later | TCP and UDP connections per process on one PC | Home users and support staff |
| Cisco Secure Network Analytics | Paid | Cisco enterprise deployment | Traffic telemetry for threat detection | Enterprise security teams |
| FortiAnalyzer | Paid | Appliance, VM or cloud | Logs and telemetry from the Fortinet Security Fabric | FortiGate customers |
| Azure Network Watcher | Pay as you go, free units | Microsoft Azure | Flow logs, packet capture and connectivity in Azure | Teams running workloads in Azure |
| IBM SevOne | Paid | Enterprise deployment | Network performance across hybrid networks | Large enterprises and MSPs |
What is a network analyzer and how does it work?
A network analyzer captures or collects data about network traffic and presents it so you can see what is happening. Wireshark's documentation compares a packet analyzer to a voltmeter for a network cable.
Network analysis is the work of reading that data: who is talking to whom, which protocols they use, how much traffic flows and where it fails. A network traffic analyzer is the same kind of tool, and each tool in this list collects its traffic data a different way.
| Data source | How it works | Example tool |
|---|---|---|
| Packet capture | Copies packets from a network interface and decodes each protocol layer | Wireshark, Packet Monitor |
| Active scanning | Sends probe packets and reads the replies to map hosts and services | Nmap |
| Endpoint tables | Reads the operating system's list of open connections | TCPView |
| Flow records and telemetry | Summarises who talked to whom, when and how much, without full packets | Cisco Secure Network Analytics, Azure Network Watcher |
| Device logs | Collects and correlates logs from firewalls and other devices | FortiAnalyzer |
Why use a network analyzer?
Network analysis matters because it replaces guesses with evidence. The benefits below are the main reasons teams add a network analysis solution, and each points to the tool that delivers it.
| Goal | What the analyzer shows | Tool to start with |
|---|---|---|
| Troubleshoot a slow or failing connection | Retransmissions, failed handshakes and dropped packets | Wireshark or Packet Monitor |
| Find out which app is using the network | The process that owns each connection | TCPView |
| Check security exposure | Open ports and services visible to others | Nmap |
| Detect threats on a business network | Unusual traffic patterns and data exfiltration | Cisco Secure Network Analytics |
| Debug an application protocol | The exact bytes sent and received | Wireshark |
| Learn how networking works | Each protocol layer of real traffic | Wireshark |
Why aren't all network monitors categorized as network analyzers?
A network monitoring tool tells you that something is wrong; a network analyzer helps you find out why. Monitors poll devices for uptime, bandwidth and errors, while analyzers dig into packets, flows or logs.
| Network monitor | Network analyzer | |
|---|---|---|
| Main question | Is the network up and performing? | What exactly is in the traffic, and why did it fail? |
| Typical data | Device status, interface counters, response times | Packets, protocol fields, flow records, logs |
| Time frame | Continuous, with alerts and history | Often a focused capture during an incident |
| Example from this list | IBM SevOne, Azure Network Watcher connection monitor | Wireshark, Packet Monitor |
Some products do both. Azure Network Watcher pairs connection monitoring with packet capture, and Packet Monitor adds counters to its captures.
Right-sizing network analyzers
| Network size | Recommended tools | Reason |
|---|---|---|
| One PC or a home network | TCPView, Wireshark | Free and enough to see connections and packets on one machine |
| Small office with a few servers | Wireshark, Nmap, Packet Monitor | Free tools cover inventory, port checks and packet captures |
| Azure-hosted workloads | Azure Network Watcher | Works inside Azure, where you cannot attach your own capture hardware |
| Fortinet-based enterprise | FortiAnalyzer | Collects logs from every FortiGate in one place |
| Large Cisco or hybrid enterprise | Cisco Secure Network Analytics, IBM SevOne | Built to scale across many sites, clouds and SD-WAN links |
Key points to consider before purchasing a network analyzer
| What to check | Why it matters |
|---|---|
| Packets, flows or logs | Packet tools show contents; flow and log tools scale further but show less detail |
| Where your network lives | On-premises, Azure and hybrid networks need different collection methods |
| Existing vendor | FortiAnalyzer and Cisco Secure Network Analytics work best with their own vendor's devices |
| Pricing model | Azure bills per GB and per check, while appliance products are licensed up front |
| Storage | Full packet captures and long log retention need a lot of disk space |
| Skills on the team | Wireshark rewards protocol knowledge; managed dashboards suit smaller teams |
| Free alternative first | Try Wireshark, Packet Monitor or Nmap before buying, to confirm what you actually need |
Network analyzer vs vector network analyzer and spectrum analyzer
The term network analyzer also names an electronics test instrument, which is a different thing from the software tools above. RF network analyzers measure electrical networks such as amplifiers, filters and cables.
| Device | What it measures | Used for |
|---|---|---|
| Software network analyzer | Packets, flows and logs on a data network | IT troubleshooting and security |
| Vector network analyzer (VNA) | Amplitude and phase of S-parameters | RF design, filters, cables and antennas |
| Scalar network analyzer (SNA) | Amplitude only | Simpler RF measurements |
| Spectrum analyzer | Signal power across frequencies | An SNA is a spectrum analyzer combined with a tracking generator |
Makers of RF vector network analyzers include Keysight, Anritsu, Rohde & Schwarz and SIGLENT. None of the eight tools in this list measure RF signals.
How to check your network analyzer is capturing traffic
- Start a capture in Wireshark on the interface that carries your traffic.
- Open a website in your browser.
- Confirm new rows keep appearing in the Wireshark packet list.
- Apply the
dnsdisplay filter and check that the site's name appears in the queries. - In Packet Monitor, run
pktmon countersduring the capture and confirm the Tx and Rx counters rise. - In TCPView, confirm a new green row appears for your browser's connection.
Network analyzer tools FAQ
What is a network analyzer?
A network analyzer is software that captures or collects network traffic data and presents it for inspection. Packet analyzers such as Wireshark decode every packet, while flow and log analyzers such as Azure Network Watcher and FortiAnalyzer summarise traffic across a whole network.
How does a network analyzer work?
A packet analyzer copies packets from a network interface and decodes each protocol layer, from Ethernet up to the application. Other analyzers read flow records, device logs or the operating system's connection table instead, which scales further but shows less detail per conversation.
How do you use a network analyzer?
Install the analyzer, start a capture on the interface that carries the traffic, and reproduce the problem. Then filter the results down to the hosts, ports or protocols involved, and stop the capture. Save the file so you can review or share it later.
How do you use the Wireshark network analyzer?
Open Wireshark and double-click your network interface on the welcome screen to start capturing. Type a display filter such as dns in the filter bar and press Enter. Choose Capture > Stop when you are done, then save the capture with File > Save.
What is the best free network analyzer?
Wireshark is the best free network analyzer for most people. It is open source under the GPL version 2, has no paid or demo edition, decodes hundreds of protocols and runs on Windows, macOS and Linux. On Windows, the built-in Packet Monitor is a free alternative that needs no install.
Does Windows have a built-in network analyzer?
Yes. Packet Monitor, run with the pktmon command, is built into Windows 10, Windows 11 and Windows Server 2019 and later. It captures packets, counts them, reports drops with reasons, and can convert its logs to pcapng for Wireshark.
Why is network analysis important?
Network analysis shows what is actually crossing the wire, so you can prove the cause of a fault instead of guessing. It helps find slow or failing connections, unknown devices, exposed services and suspicious traffic before they cause outages or breaches.
What is a vector network analyzer?
A vector network analyzer, or VNA, is an electronics test instrument that measures both the amplitude and phase of an electrical network's S-parameters. Engineers use it to characterise RF components such as filters, amplifiers and cables. It is unrelated to software network analyzers like Wireshark.
Can a network analyzer measure insertion loss?
Yes, an RF network analyzer can. Insertion loss is the signal power lost when a device is inserted into a transmission line, and it is calculated from the transmission S-parameter that a vector network analyzer measures. Software network analyzers such as Wireshark cannot measure it.
What is the difference between a network analyzer and a spectrum analyzer?
A spectrum analyzer measures signal power across a range of frequencies. An RF network analyzer sends a known signal through a device and measures its response. A scalar network analyzer is essentially a spectrum analyzer combined with a tracking generator.
Which network analyzer tool should you pick?
Start with Wireshark for packet-level troubleshooting, add Nmap for inventory and TCPView for per-app connections, and buy Cisco Secure Network Analytics, FortiAnalyzer, Azure Network Watcher or IBM SevOne only when one network outgrows free tools. The free tools answer most what-is-happening questions at no cost, while the paid platforms earn their price through scale, central logging and threat detection across many sites, clouds or vendor devices.