OpenJDK Platform binary is a Java program (java.exe or javaw.exe) running on your PC, so you fix its high memory or CPU usage by finding which app started it, then capping its heap, tuning garbage collection, or updating the app and its Java runtime.
The 8 fixes below run from the quick checks any user can make in Task Manager to the JVM options and code changes developers can apply.
1. Monitor and Diagnose Performance Issues
Start by identifying the app. The process is only the Java runtime; the real cause is the program it is running, such as a game, an IDE, a build tool or a background server.
- Press Ctrl + Shift + Esc to open Task Manager.
- On the Processes tab, sort by Memory or CPU and expand OpenJDK Platform binary to see the window it belongs to.
- Right-click it and select Open file location to see which app folder the java.exe or javaw.exe sits in.
- If you do not need that app right now, close it normally, or right-click the process and select End task.
- Developers: open Command Prompt and run
jcmdto list running JVMs with their process IDs and main classes. - Run
jcmd <pid> VM.flagsto see the heap size and garbage collector the process is using.
jcmd ships in the bin folder of a full JDK and must run as the same user that started the Java process. Ending the task stops the app without saving its work.
2. Optimize your Garbage Collection Settings
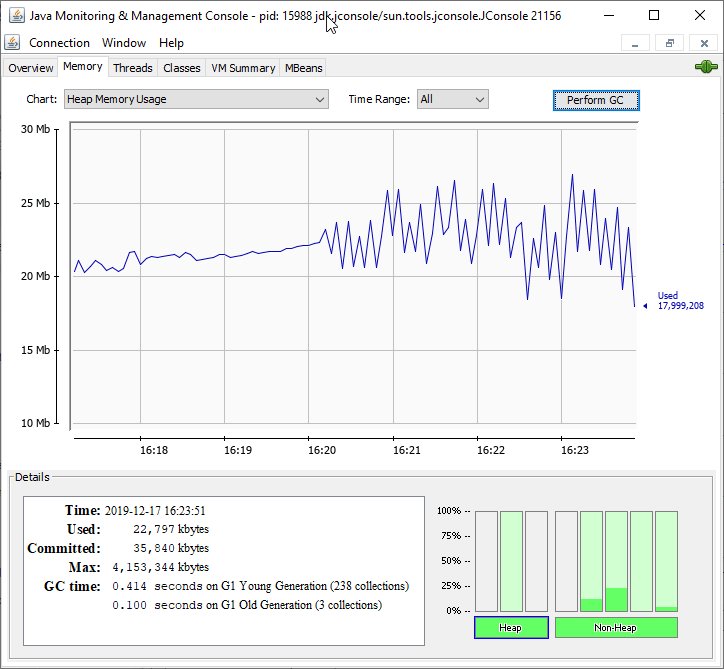
Garbage collection (GC) is the JVM reclaiming unused memory, and it is a common source of CPU spikes. Oracle's advice is to let the JVM pick the collector first, size the heap correctly, and only then switch collectors.
| What you see | JVM option to try | Effect |
|---|---|---|
| Short CPU spikes and stutters | -XX:+UseG1GC -XX:MaxGCPauseMillis=200 |
G1 aims to keep pauses near the target; 200 ms is its default |
| Long pauses on a large heap | -XX:+UseZGC -XX:+ZGenerational |
Sub-millisecond pauses at some cost to throughput |
| Small app (about 100 MB of data) using many cores for GC | -XX:+UseSerialGC |
One GC thread, no thread overhead |
| Batch job where pauses do not matter | -XX:+UseParallelGC |
Best overall throughput on multicore PCs |
Add JVM options in the app's own launcher or JVM-arguments setting. For apps started with the java command, the JDK_JAVA_OPTIONS environment variable prepends options to every launch.
3. Improve Thread Management
Constant high CPU often means one or more threads are stuck in a busy loop. A thread dump shows what each thread is doing.
- Find the process ID with
jcmd. - Run
jcmd <pid> Thread.printand save the output. - Wait 10 to 20 seconds and run it again.
- Compare the two dumps: threads in the RUNNABLE state at the same code line both times are your CPU consumers.
- Fix or report that code, or limit the threads the JVM sizes its pools for with
-XX:ActiveProcessorCount=<n>. - Cut GC worker threads with
-XX:ParallelGCThreads=<n>if garbage collection threads dominate.
4. Profile Memory Usage and Mitigate Leaks
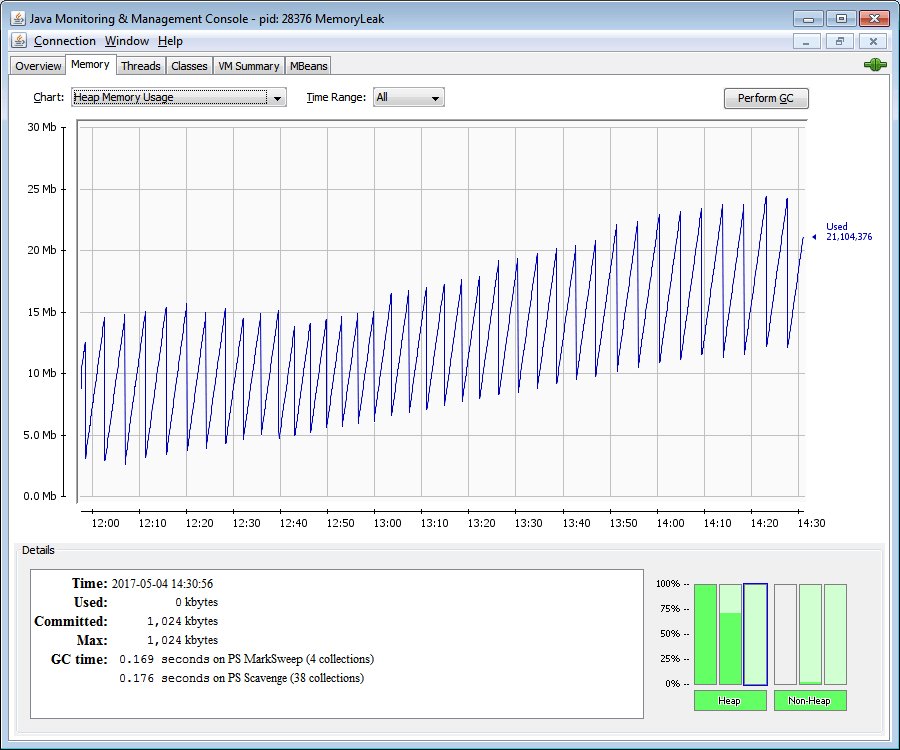
A memory leak is an app holding references to objects it no longer needs, so the heap never shrinks after garbage collection. Profile it before you raise any limits.
- Run
jcmd <pid> GC.heap_infoto see current heap use. - Run
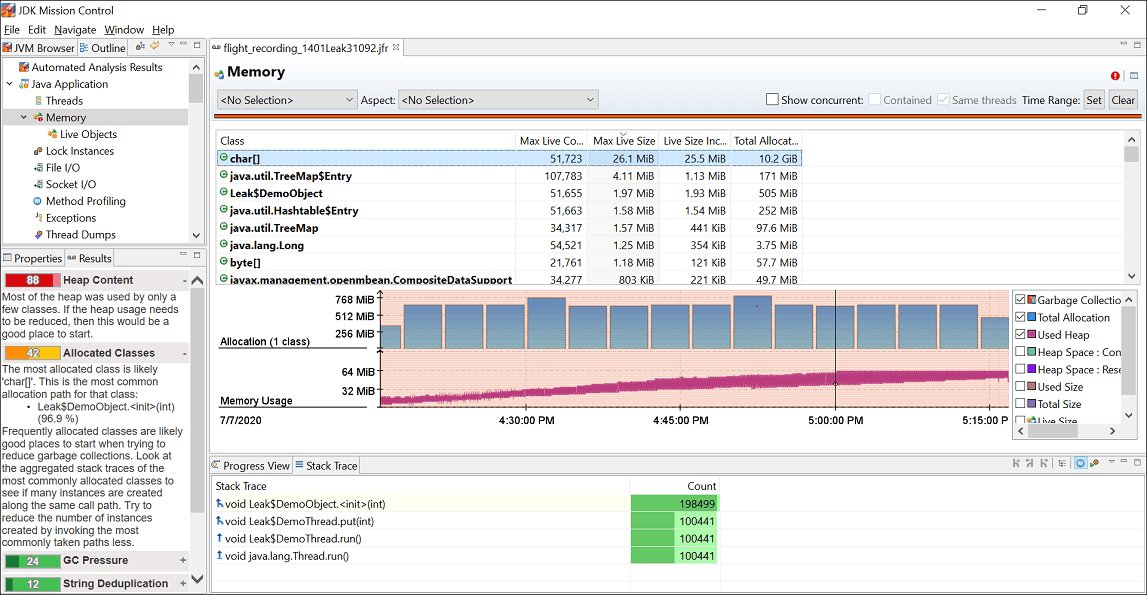
jcmd <pid> GC.class_histogramto list the classes using the most memory, largest first. - Repeat the histogram after the app has run a while; a class whose count keeps climbing is the likely leak.
- Record a Flight Recorder profile:
jcmd <pid> JFR.start name=MyRecording settings=profile duration=2m filename=C:\TEMP\myrecording.jfr. - Open the recording in JDK Mission Control and review the memory and garbage collection pages.
- Add
-XX:+HeapDumpOnOutOfMemoryErrorso the next crash writes ajava_pid<pid>.hprofheap dump you can analyze.
5. Fine-tune Java Application Configuration
If no -Xmx is set, the JVM picks a maximum heap at runtime; by default that is up to 25 percent of the memory it detects. A too-large heap lets Java hog RAM, and a too-small one makes it collect garbage constantly and burn CPU.
| Problem | Option | Example |
|---|---|---|
| Java takes too much RAM | Set a lower maximum heap | -Xmx2g |
| Heap keeps growing and shrinking | Set initial and maximum heap to the same value | -Xms2g -Xmx2g |
| Heap should scale with available RAM | Set a percentage instead of a fixed size | -XX:MaxRAMPercentage=50 |
| Class metadata (Metaspace) keeps growing | Cap Metaspace | -XX:MaxMetaspaceSize=256m |
| Several Java processes share one PC | Give each its own cap so they do not compete | -Xmx1g per process |
6. Optimize Database Connections and Queries
For server and business apps, high memory and CPU often trace back to the database layer rather than the JVM. These checks apply to apps you or your team maintain.
- Use a connection pool with a fixed maximum size instead of opening a new connection per request.
- Close connections, statements and result sets in
try-with-resourcesblocks so they are released. - Fetch only the columns and rows you need, and page large result sets instead of loading them whole.
- Run a Flight Recorder profile under real load and look for hot methods in the database driver.
- Add indexes or rewrite the slow queries that profile points to.
7. Leverage Efficient Data Structures
The class histogram from fix 4 usually points at the collections holding the most memory.
- Check the top entries of
jcmd <pid> GC.class_histogramfor arrays, maps and lists. - Put a size limit or eviction rule on any cache built from a map or list.
- Remove entries from long-lived collections when the objects they reference are finished with.
- Replace
finalize()methods, because objects with finalizers are not reclaimed until a separate thread processes them. - Stream or process large files in chunks instead of reading them fully into memory.
8. Update Java Runtime and Libraries
Many apps bundle their own Java runtime, so updating the app is often how the runtime gets updated.
- Run
java -versionin Command Prompt to see the installed runtime version. - Update the app that owns the process to its latest release.
- If you installed a JDK yourself, get the current build from your vendor, such as jdk.java.net for OpenJDK builds.
- Update the app's libraries and frameworks if you maintain it, since leaks are often fixed upstream.
- Restart the app and compare memory and CPU in Task Manager.
What is OpenJDK Platform binary?
| Question | Answer |
|---|---|
| What it is | The Java launcher from an OpenJDK build, shown by its file description in Task Manager |
| File names | java.exe, or javaw.exe for apps that run without a console window |
| Why it runs | An installed program needs Java: games, IDEs, build tools, local servers |
| Is it safe? | Yes when it sits inside a known app or JDK folder; check the folder with Open file location |
| Can you remove it? | Uninstall the app that uses it; deleting the runtime alone breaks that app |
How to check the fix worked
- Restart the Java app after changing its options.
- Run
jcmd <pid> VM.flagsand confirm your new heap and GC options are listed. - Use the app normally for 15 to 30 minutes.
- Watch OpenJDK Platform binary in Task Manager; memory should level off below your
-Xmxvalue plus some native overhead. - If CPU stays high after Java is closed, look at other processes, such as Antimalware Service Executable high CPU or WSAPPX using the CPU.
Fix OpenJDK Platform binary errors and freezes
OpenJDK Platform binary not responding
The app is stuck in a long garbage collection or a blocked thread.
- Wait a minute to let a long garbage collection finish.
- Run
jcmd <pid> Thread.printto capture what it is doing. - Select End task in Task Manager if it stays frozen, then restart the app.
java.lang.OutOfMemoryError: Java heap space
The heap is too small for the app, or a leak filled it.
- Raise
-Xmxmoderately. - If the error returns, profile the leak with fix 4.
java.lang.OutOfMemoryError: GC overhead limit exceeded
The JVM spends about 98 percent of its time collecting garbage and recovers under 2 percent of the heap.
- Increase the heap so live data has room.
- Look for a leak with
GC.class_histogram.
java.lang.OutOfMemoryError: Metaspace
Class metadata exceeded MaxMetaspaceSize.
- Raise
-XX:MaxMetaspaceSizeif it was set. - Check for apps that keep loading new classes, such as repeated plugin reloads.
Frequently asked questions
What is OpenJDK Platform binary?
It is the Java launcher (java.exe or javaw.exe) from an OpenJDK build. It appears in Task Manager whenever a program written in Java is running, and it uses whatever memory and CPU that program needs.
Is OpenJDK Platform binary safe?
Yes, when the file is inside a known app's folder or a JDK installation. Right-click it in Task Manager and select Open file location to check, and scan anything in an unexpected folder with your antivirus.
Why is OpenJDK Platform binary running?
A program on your PC that is written in Java is open or running in the background. Expand the entry in Task Manager or open its file location to see which one.
How do I stop or close OpenJDK Platform binary?
Close the Java app that started it. If it is frozen, right-click OpenJDK Platform binary in Task Manager and select End task; unsaved work in that app is lost.
How do I disable OpenJDK Platform binary?
Stop or uninstall the app that uses it, or remove that app from startup. Disabling Java itself breaks every program that depends on it.
How do I fix OpenJDK Platform binary in Minecraft?
Minecraft: Java Edition runs on Java, so the game appears as this process while it plays. Close other apps, update the game, and lower any large -Xmx value you added to its JVM arguments if RAM use is the problem.
How much memory should OpenJDK Platform binary use?
It uses up to its maximum heap plus extra native memory. Without -Xmx, the JVM picks the maximum at runtime, by default up to a quarter of detected memory.