Press Windows key + G to open Xbox Game Bar and pin its Performance widget, which shows an FPS counter over almost any PC game on Windows 11 and Windows 10.
This guide also covers the Steam Performance Monitor, the NVIDIA app overlay, AMD and MSI tools, Intel PresentMon, in-game counters such as Roblox's, and what to do when the counter will not appear.
Method 1: Show FPS Using Xbox Game Bar On Windows
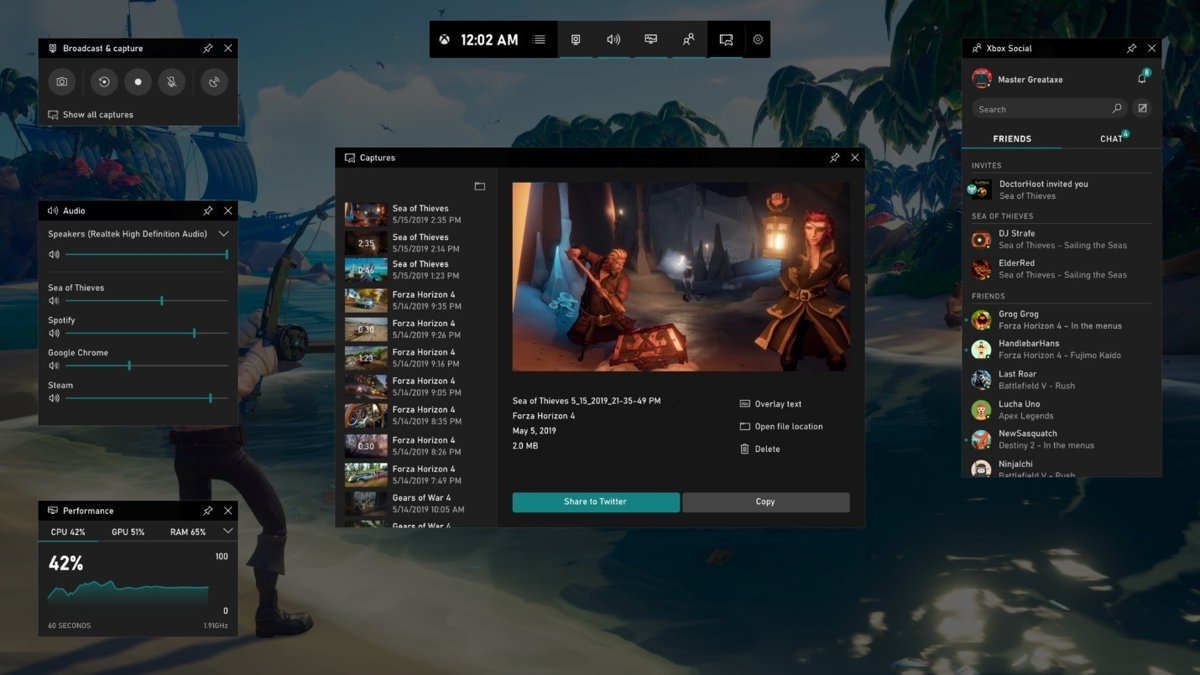
Game Bar is built into Windows 10 and Windows 11 and works with most PC games, whichever store or launcher they came from. Microsoft added the FPS counter to its Performance overlay in October 2019.
- Start your game.
- Press Windows key + G to open Game Bar.
- Open the overlay menu at the top of the screen and select Performance.
- Select FPS in the Performance widget to see the frame rate.
- Select the pin icon on the widget so it stays on screen after you close Game Bar.
- Press Windows key + G again to return to the game; the pinned counter stays visible.
Microsoft notes that some Game Bar features need Windows 10 22H2 or newer, and that many Xbox features in Game Bar need the Xbox app installed and signed in.
What Is an FPS Counter?
FPS means frames per second: how many new images the game draws and sends to your monitor each second. An FPS counter is a small overlay that reports that number while you play.
| Frame rate | Time per frame | What it usually feels like |
|---|---|---|
| 30 FPS | 33.33 ms | Playable but less smooth; the low end for most games |
| 60 FPS | 16.67 ms | Smooth for most players |
| 120 FPS | 8.33 ms | Very smooth on a high refresh rate monitor |
| 240 FPS | 4.17 ms | Competitive play on a 240 Hz monitor |
Divide 1,000 by the frame time in milliseconds to get the frame rate. Many counters also show CPU, GPU and memory use next to the FPS figure.
Best Ways To Show FPS On PC
Every tool below is free. They differ in which hardware and games they cover and in how much detail they show.
| Tool | Works with | How to open it | Extra detail |
|---|---|---|---|
| Xbox Game Bar | Most PC games on Windows 10 and 11 | Windows key + G | CPU, GPU, RAM next to FPS |
| Steam Performance Monitor | Games running through Steam | Steam Settings > In Game | Min/max FPS, frame generation, CPU, GPU, RAM |
| NVIDIA app overlay | PCs with an NVIDIA GeForce GPU | Alt+Z, then Alt+R for statistics | 1% lows, CPU and GPU use, PC latency |
| AMD Software: Adrenalin Edition | PCs with an AMD Radeon GPU | AMD Software app | GPU metrics overlay |
| MSI Afterburner with RivaTuner | Most graphics cards | Afterburner monitoring settings | Highly customisable on-screen display |
| Intel PresentMon | Intel and other vendors' hardware | PresentMon app | GPU Busy metric, graphs, captures |
| Built-in game counter | That game only | The game's settings or a shortcut | Varies by game |
Which FPS Counter Should You Use?
| Your situation | Use this | Why |
|---|---|---|
| You want a counter now with nothing to install | Xbox Game Bar | Built into Windows 10 and 11 |
| You play mostly through Steam | Steam Performance Monitor | Shows real game FPS separately from frame-generated FPS |
| You have an NVIDIA GeForce GPU | NVIDIA app overlay | Alt+R toggles it, with latency and 1% low figures |
| You have an AMD Radeon GPU | AMD Software overlay or Game Bar | Driver-level overlay, or the Windows one if you prefer |
| You want to find a CPU or GPU bottleneck | Intel PresentMon or Steam | GPU Busy and per-core CPU figures show which part limits FPS |
| You only care about one game | That game's own counter | No overlay software running at all |
Method 2: Show FPS Using Steam
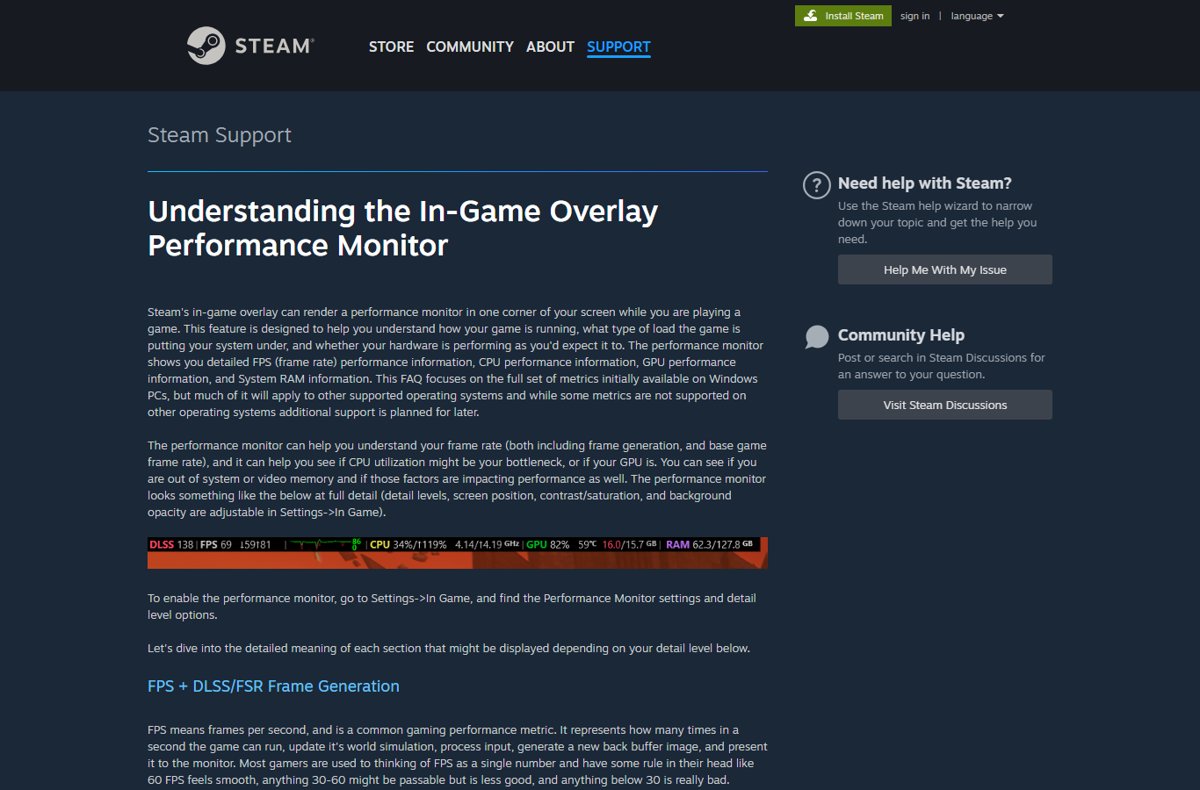
Steam's in-game overlay includes a Performance Monitor that shows FPS, CPU, GPU and RAM figures in a corner of the screen.
- Open Steam and select Steam > Settings.
- Select In Game.
- Find the Performance Monitor settings and choose a detail level.
- Choose the screen position, contrast and background opacity if you want to change them.
- Launch a game from Steam; the monitor appears in the corner you picked.
If a game uses DLSS or FSR frame generation, Steam shows the displayed frame rate and the real game frame rate separately, plus the minimum and maximum for each second.
Method 3: Show FPS With NVIDIA App Overlay
The NVIDIA app is NVIDIA's driver and settings app for GeForce cards. Its in-game overlay can show FPS, FPS 1% Low, GPU and CPU use, and PC latency.
- Install the NVIDIA app from nvidia.com and sign in if prompted.
- Start a game.
- Press Alt + Z to open the NVIDIA overlay.
- Open the performance options and choose which statistics to show and where.
- Press Alt + R to turn the performance statistics on or off.
Method 4: Show FPS With AMD Software: Adrenalin Edition
AMD Software: Adrenalin Edition is AMD's driver app for Radeon graphics. It includes its own metrics overlay for frame rate and GPU readings.
- Install AMD Software: Adrenalin Edition from AMD's drivers and support page for your Radeon card.
- Open AMD Software from the Start menu.
- Open its performance metrics section and turn on the metrics overlay.
- Start a game to see the overlay in the corner of the screen.
- If you prefer one counter for every PC, use Game Bar or PresentMon instead; both work on Radeon hardware.
Method 5: Show FPS With MSI Afterburner And RivaTuner
MSI Afterburner is MSI's free graphics card utility, and RivaTuner Statistics Server draws its on-screen display. The pair suits players who want to choose every reading and its position.
- Download MSI Afterburner only from msi.com, and install RivaTuner Statistics Server when setup offers it.
- Open MSI Afterburner and open its settings.
- In the monitoring settings, select the frame rate reading.
- Turn on the on-screen display option for that reading and apply the change.
- Start a game with RivaTuner Statistics Server running to see the counter.
Method 6: Use Intel PresentMon Or Intel Graphics Tools
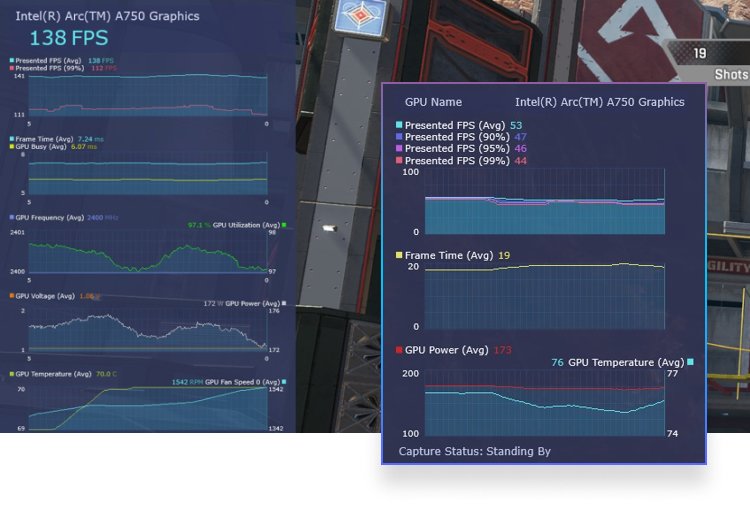
Intel PresentMon is a free, open-source overlay and capture tool. It works with Intel Arc graphics and Intel Core processors, and with other vendors' hardware too.
- Download Intel PresentMon from Intel's game.intel.com PresentMon page.
- Install and open PresentMon.
- Choose the game process you want to monitor.
- Turn on the overlay and pick the metrics, such as FPS and GPU Busy.
- Use the capture option if you want to save the data for later review.
GPU Busy shows how long the GPU worked on each frame. When it is far below the frame time, the CPU or game engine is holding the frame rate back.
Method 7: Use Built-In FPS Counters In Games
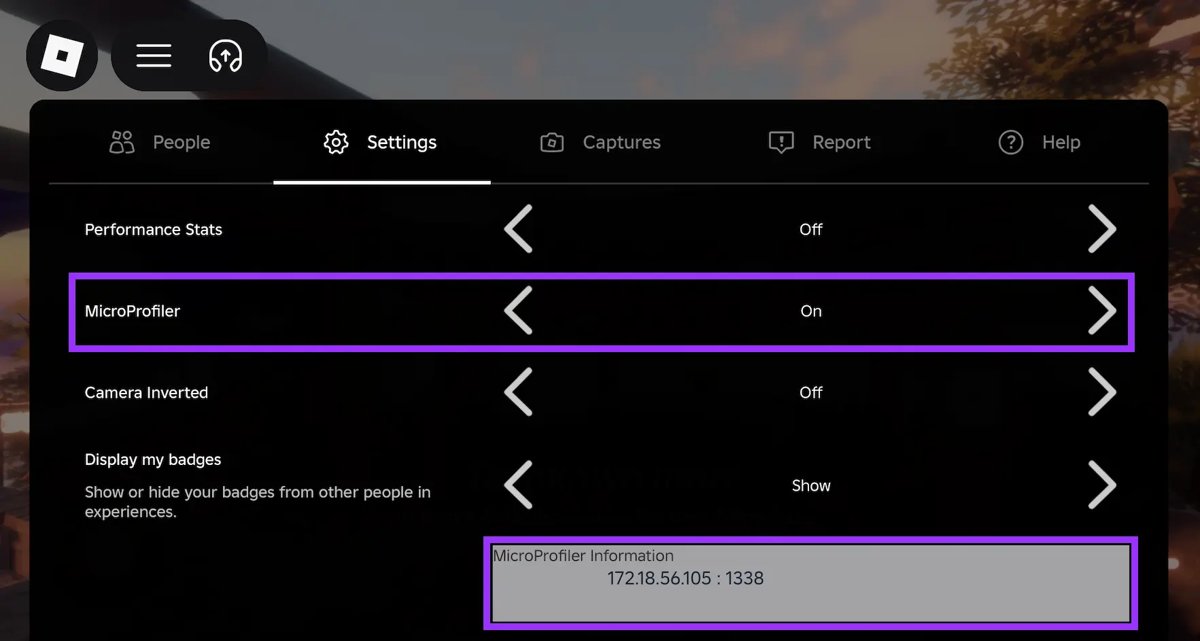
Many games have their own counter, usually in the graphics or video settings or behind a debug shortcut. A built-in counter needs no extra software.
| Game | How to show FPS | What else it shows |
|---|---|---|
| Roblox (desktop) | Press Shift + F5 | Debug stats summary |
| Roblox (detailed) | Press Ctrl + Shift + F1 to F5 | Graphics, physics, network and FPS overlays |
| Roblox (performance) | Press Ctrl + Alt + F7 | Performance Stats toolbar: memory, CPU, GPU, network |
| Fortnite, Minecraft, Call of Duty and other titles | Look in the game's video or display settings | Use Game Bar if the game has no counter |
Method 8: FPS Counters In Other Game Launchers
Games from other launchers, such as the EA app, Ubisoft Connect or the Epic Games Launcher, still run on Windows, so the system-wide overlays work on them.
- Start the game from its launcher.
- Press Windows key + G and pin the Game Bar Performance widget.
- Or press Alt + R on an NVIDIA PC to show the NVIDIA statistics overlay.
- Or open Intel PresentMon and select the game's process.
- Check the launcher's own overlay settings too; if it has a counter, use only one overlay at a time.
How To Show FPS In Almost Any Game
Pick the overlay by where the game runs, not by the game. These routes cover nearly every PC game.
| Where the game runs | Overlay that works | Shortcut |
|---|---|---|
| Any launcher on Windows 10 or 11 | Xbox Game Bar Performance widget | Windows key + G |
| Steam | Steam Performance Monitor | Turn on in Settings > In Game |
| Any launcher, NVIDIA GPU | NVIDIA app statistics overlay | Alt + R |
| Any launcher, any GPU | Intel PresentMon | Select the game process |
| Roblox | Roblox debug stats | Shift + F5 |
How to check the FPS counter is working
- Start a game and play for a minute; the number should change as the scene changes.
- Look at a busy scene, then a quiet one; FPS should drop and rise.
- Compare with a second counter, such as Game Bar against Steam; they should read within a few frames of each other.
- If the number never goes above your monitor's refresh rate, V-Sync or a frame cap is limiting it, and the counter is still correct.
Why Your FPS Counter Is Not Showing
Game Bar does not open with Windows key + G
Game Bar is out of date, or Windows is older than 10 22H2.
- Check your version in Settings > System > About > Windows Specifications > Version.
- Install the latest Windows updates.
- Update Game Bar from the Microsoft Store.
Game Bar opens, but the FPS counter disappears in the game
The Performance widget is not pinned.
- Press Windows key + G.
- Select the pin icon on the Performance widget.
- Press Windows key + G to close Game Bar.
Steam Performance Monitor does not appear
The game was not started through Steam, or the monitor is set to off.
- Open Steam > Settings > In Game and set a Performance Monitor detail level.
- Launch the game from your Steam library.
NVIDIA overlay shows nothing when you press Alt + R
The NVIDIA in-game overlay is closed or not enabled.
- Press Alt + Z to confirm the overlay opens.
- Turn on the in-game overlay in the NVIDIA app if Alt + Z does nothing.
- Press Alt + R again in the game.
My PC shows FPS, GPU, CPU and latency I did not turn on
An overlay such as the NVIDIA statistics overlay or the Steam Performance Monitor is switched on.
- Press Alt + R to hide the NVIDIA statistics overlay.
- Set the Steam Performance Monitor to off in Settings > In Game.
- Unpin the Game Bar Performance widget.
Does An FPS Counter Lower Performance?
Leave one counter on while you tune settings, and turn extra overlays off once you are done. An overlay is extra software drawing on top of the game, and running two or three at once multiplies that work and the chance of conflicts. Test the cost on your own PC by noting FPS in one scene with the overlay on and with only a second, lighter counter.
Tips For Reading FPS Correctly
| Reading | What it tells you | What to do |
|---|---|---|
| Average FPS | General smoothness over the last second | Aim for at least your target, such as 60 |
| Minimum or 1% low FPS | The worst frames; stutter shows here | A low minimum with a good average means micro stutter |
| Frame generation FPS vs game FPS | DLSS or FSR adds frames that do not process input | Judge input feel by the real game FPS |
| GPU near 100% | The graphics card limits FPS | Lower resolution or graphics settings |
| One CPU core near or above 100% while GPU is low | The processor limits FPS | Lower CPU-heavy settings or close background apps |
| GPU memory used above the total | The game needs more video memory | Lower texture quality |
Frequently Asked Questions
How do I show FPS on PC?
Press Windows key + G to open Xbox Game Bar, open the Performance widget, select FPS and pin it. The counter then stays on screen in almost any game on Windows 10 and Windows 11, with nothing extra to install.
How do I show FPS on PC with NVIDIA or GeForce?
Install the NVIDIA app, start a game and press Alt + R to toggle the performance statistics overlay. Press Alt + Z to open the full overlay and choose which statistics, such as FPS and GPU use, appear on screen.
How do I show FPS on PC with AMD?
AMD Software: Adrenalin Edition, AMD's driver app for Radeon cards, includes a metrics overlay you turn on inside the app. Xbox Game Bar and Intel PresentMon also show FPS on AMD hardware.
How do I show FPS on PC in Steam?
Open Steam, select Steam > Settings > In Game, and set a Performance Monitor detail level. Launch a game from Steam and the monitor shows FPS, CPU, GPU and RAM in the corner you chose.
How do I show FPS in Roblox on PC?
Press Shift + F5 in the Roblox desktop app to show the debug stats summary, which includes the frame rate. Ctrl + Alt + F7 opens the Performance Stats toolbar with memory, CPU, GPU and network figures.
How do I show FPS on PC in Fortnite, Minecraft or Call of Duty?
Check the game's video or display settings for its own frame rate option. If you cannot find one, press Windows key + G and pin the Game Bar Performance widget, which works across launchers.
How do I see FPS on a Windows 10 or Windows 11 computer?
Both versions include Xbox Game Bar. Press Windows key + G, open Performance and pin the FPS view. Microsoft says some Game Bar features need Windows 10 22H2 or newer.
Why does my PC show FPS, GPU, CPU and latency on screen?
An overlay is turned on, most often the NVIDIA statistics overlay or the Steam Performance Monitor. Press Alt + R to hide the NVIDIA one, or set Steam's Performance Monitor to off in Settings > In Game.
What determines FPS in a PC?
The graphics card, the processor, memory and the game's settings together set the frame rate. Whichever part is fully busy limits it: GPU near 100% points to the graphics card, and one busy CPU core with a lightly used GPU points to the processor.
Conclusion
Start with Xbox Game Bar for a quick FPS counter, and switch to the Steam Performance Monitor or Intel PresentMon when you need to know why the frame rate drops. Game Bar is already on every Windows 10 and 11 PC and works across launchers, while Steam and PresentMon add minimum FPS, frame generation and CPU and GPU figures that explain stutter.