To get started with WinDbg on Windows 10, install it with winget install Microsoft.WinDbg, point it at the Microsoft symbol server, open a .dmp file and run !analyze -v.
This guide covers installing WinDbg on Windows 10 version 1607 or newer, making Windows save crash dumps, reading blue screen and app crash output, attaching to a live process, and fixing the problems beginners hit first.
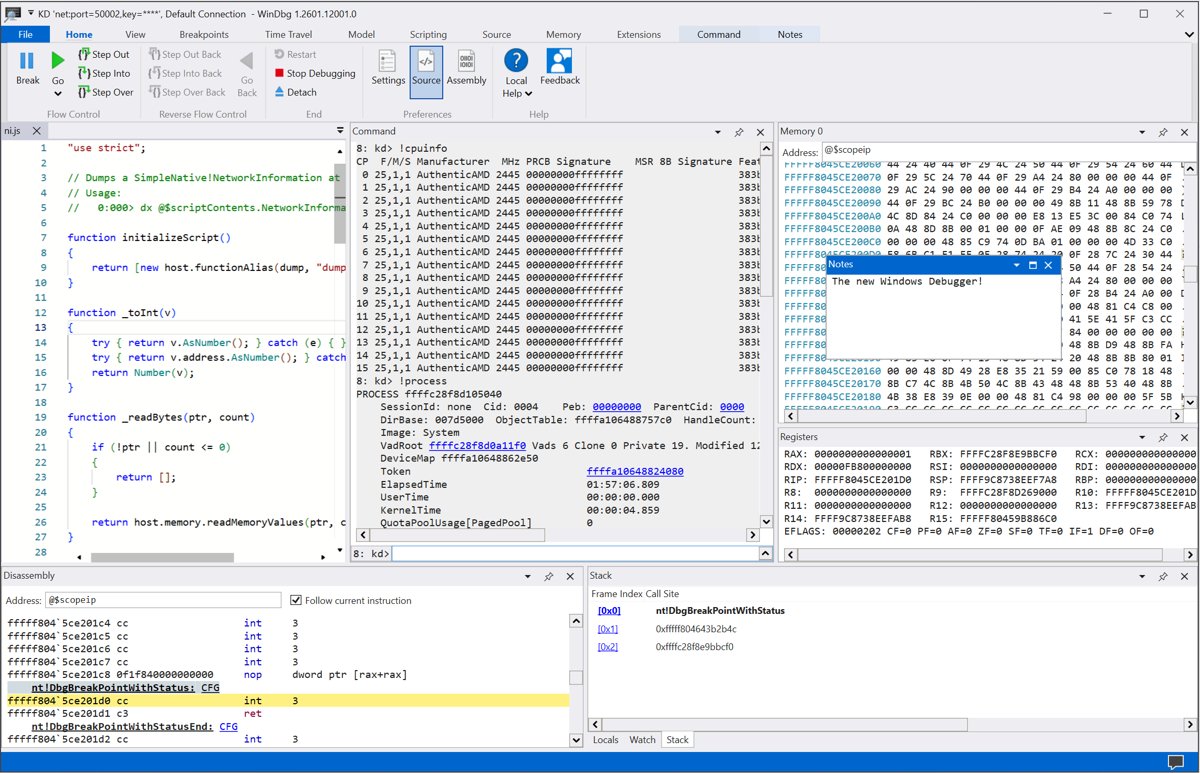
The fastest way to analyze a crash dump with WinDbg
These five steps take you from nothing installed to a readable crash analysis. Every later section expands one of them.
- Open Windows PowerShell and run
winget install Microsoft.WinDbg. - Start WinDbg from the Start menu, or run
WinDbgXfrom any command prompt. - Press Ctrl + D to open a dump file, then browse to your
.dmpfile and open it. - In the command box at the bottom of the window, type
.symfix C:\Symbolsand press Enter, then type.reloadand press Enter. - Type
!analyze -vand press Enter. Read the bug check or exception code,MODULE_NAME,IMAGE_NAMEandSTACK_TEXTin the output.
What WinDBG Is and When You Should Use It
WinDbg is Microsoft's debugger for crash dumps, live user-mode and kernel-mode code, CPU registers and memory. It is a diagnostic tool, not a repair tool: it tells you which driver or module failed, and the fix happens elsewhere.
| Your situation | Is WinDbg the right tool? | What it gives you |
|---|---|---|
| Windows 10 shows a blue screen and restarts | Yes | The stop code, its four parameters and the driver most likely at fault |
| A desktop app keeps crashing | Yes, with a dump of that app | The exception code, the faulting module and the call stack |
| An app hangs but does not crash | Yes | !analyze -hang looks for threads blocking other threads |
| You are debugging your own C or C++ code | Yes | Breakpoints, stepping, source lines and variables when you have the .pdb file |
| You are debugging C# in Visual Studio | Usually not | Microsoft notes the Visual Studio debugger is often the easiest start for managed code |
| You just want the stop code name | Not required | The System log in Event Viewer lists the bug check parameters without a debugger |
WinDBG Classic vs WinDBG Preview
WinDbg Preview no longer exists under that name. Microsoft now ships it simply as WinDbg, and the older debugger is called WinDbg (classic).
Both use the same debugging engine, so every command in this guide works in either one.
| WinDbg (formerly WinDbg Preview) | WinDbg (classic) | |
|---|---|---|
| How you get it | Direct installer, Microsoft Store or winget install Microsoft.WinDbg |
Debugging Tools for Windows, part of the Windows SDK or WDK |
| Windows it runs on | Windows 11, and Windows 10 version 1607 or newer | Use it when you must debug older versions of Windows |
| Processors | x64 and ARM64 | x86, x64 and Arm |
| Updates | Automatic when installed directly or from the Store; winget upgrade Microsoft.WinDbg otherwise |
Updated with the SDK or WDK you install |
| Extras | Time Travel Debugging, dark theme, scripting window, data model window, saved sessions | Classic menus and workspaces |
| Launch command | WinDbgX |
windbg |
| Pick it when | You are starting out on Windows 10 or 11 | A tutorial or policy requires the SDK tools, or the target runs older Windows |
Step 1: Install WinDBG on Windows 10
Your PC needs Windows 10 version 1607 (Anniversary Update) or newer on an x64 or ARM64 processor. Microsoft offers three install routes; winget is the quickest to type.
- Open Windows PowerShell from the Start menu.
- Run
winget install Microsoft.WinDbgand wait for the install to finish. - If you prefer the Store, open Microsoft Store, search for WinDbg, and install the app published by Microsoft.
- If you use neither, open the Install WinDbg page on Microsoft Learn and use its Download WinDbg link.
- Close and reopen PowerShell, then run
WinDbgXto confirm the debugger starts. - To update a winget install later, run
winget upgrade Microsoft.WinDbg. Store and direct installs update themselves in the background.
Need WinDbg (classic) instead? Run the Windows SDK installer and select only Debugging Tools for Windows in the feature list.
Step 2: Understand the Types of Dumps You Can Analyze
A dump is a snapshot of memory written to a file, usually ending in .dmp or .mdmp. Kernel dumps come from blue screens; user-mode dumps come from a single app.
| Dump type | Kind | What it holds | Default location or source |
|---|---|---|---|
| Small memory dump | Kernel (blue screen) | Stop code and parameters, loaded driver list, the crashing thread and its kernel call stack. 64 KB. | %SystemRoot%\Minidump, a new file per crash |
| Kernel memory dump | Kernel | Memory used by the kernel, HAL and drivers; no user-mode program memory | %SystemRoot%\Memory.dmp |
| Automatic memory dump | Kernel | Same contents as a kernel memory dump; Windows manages the paging file size | %SystemRoot%\Memory.dmp |
| Active memory dump | Kernel | Close to a complete dump for most purposes, but smaller | %SystemRoot%\Memory.dmp |
| Complete memory dump | Kernel | All physical memory, including data from running processes | %SystemRoot%\Memory.dmp |
| Full user-mode dump | User mode | The whole memory space of one process, its image and handle table | Windows Error Reporting, ProcDump -ma, Task Manager |
| Minidump | User mode | Anywhere from stacks only to full memory, depending on options | ProcDump default, .dump /m in WinDbg |
For a first blue screen, the small memory dump is enough. Microsoft calls the kernel memory dump the most useful for most purposes because it drops only memory unlikely to be involved.
Step 3: Configure Windows to Create Crash Dumps
WinDbg can only read a dump that Windows actually wrote. You need an administrator account for these steps.
- Open Control Panel and select System and Security > System.
- Select Advanced system settings, then open the Advanced tab.
- In the Startup and Recovery area, select Settings.
- Under Write debugging information, choose Small memory dump, Kernel memory dump, Automatic memory dump, Active memory dump or Complete memory dump.
- Optionally change the Dump file field from
%SystemRoot%\Memory.dmpto a drive with more free space. - Select OK and restart the computer so the change takes effect.
App crashes need a separate switch. Windows Error Reporting saves full or mini dumps of crashing apps when you create the HKEY_LOCAL_MACHINE\SOFTWARE\Microsoft\Windows\Windows Error Reporting\LocalDumps key. Its DumpType value takes 1 for a mini dump or 2 for a full dump, and dumps land in %LOCALAPPDATA%\CrashDumps by default.
Step 4: Set Up Symbols Correctly
Symbol files (.pdb) turn raw addresses into function and module names. Without them, !analyze -v output is mostly hex numbers.
The recommended path downloads Windows symbols from the Microsoft public symbol server and caches them in a local folder.
- Create an empty folder for the cache, such as
C:\Symbols. Keep it separate from any folder where you place symbols by hand. - Open WinDbg, click in the command box at the bottom and type
.symfix C:\Symbols, then press Enter. - Type
.sympathand press Enter. The expanded path should readcache*C:\Symbols;SRV*https://msdl.microsoft.com/download/symbols. - To add symbols for your own app, type
.sympath+ C:\MyApp\x64\Debugusing the folder that holds its.pdbfile. - Type
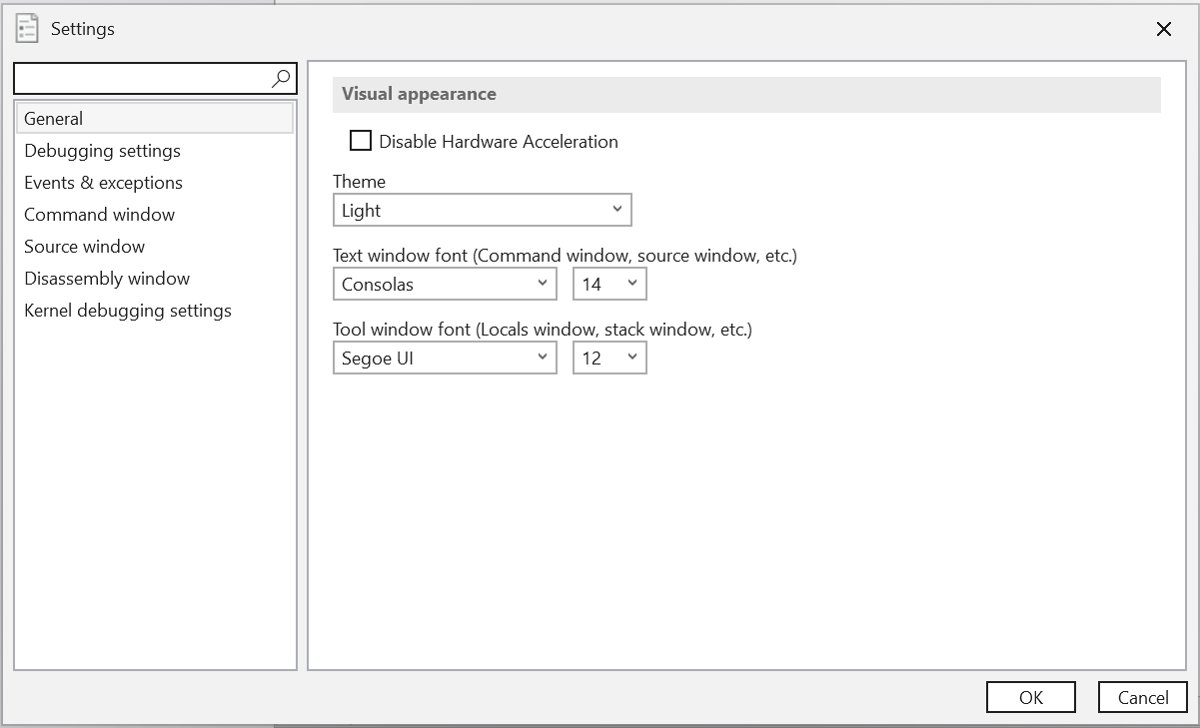
.reloadand press Enter so WinDbg searches the new path. - To keep the path for later sessions, open File > Settings and enter it as the symbol path. Settings save to the default workspace when WinDbg closes.
Prefer an environment variable? In Command Prompt, run set _NT_SYMBOL_PATH=srv*C:\Symbols*https://msdl.microsoft.com/download/symbols and start WinDbgX from that same window. The public symbol server only accepts TLS 1.2 or newer connections.
Step 5: Open Your First Dump File
The Windows version or processor that created the dump does not need to match your PC. Dumps packed in a .cab file open directly too.
- Right-click WinDbg in the Start menu and select Run as administrator if the dump sits under
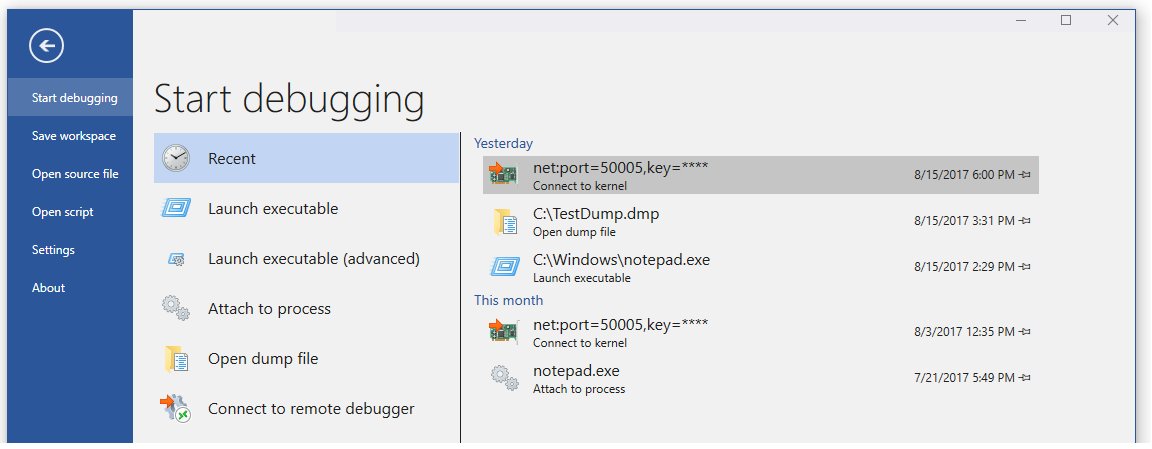
C:\Windows. - Select File > Start debugging, then choose Open dump file. Ctrl + D jumps straight there.
- Browse to the
.dmpfile and select Open. - Wait until the command prompt at the bottom shows a prompt such as
0: kd>for a kernel dump or0:000>for an app dump. - From a command line instead, run
WinDbgX -y srv*C:\Symbols*https://msdl.microsoft.com/download/symbols -z C:\Dumps\app.dmp. Put quotation marks around a path with spaces.
WinDbg can also load a second dump in the same session with .opendump, followed by g.
Step 6: Run the Most Important First Command
Microsoft describes !analyze as the first step in debugging any crashed computer or app. The -v switch makes the output verbose.
!analyze -vRuns automatic analysis of the current exception (app dump) or the most recent bug check (kernel dump) and prints the faulting instruction, the stack and a probable cause. Add -hang for a hung app, or use -vv for all available detail.
You should see: A block headed Bugcheck Analysis or Exception Analysis, followed by fields such as FAULTING_IP, STACK_TEXT, MODULE_NAME and IMAGE_NAME with readable names rather than bare addresses.
Run .bugcheck when you only want the stop code and its four parameters.
How to Read Basic WinDBG Output
You do not need to read every line. These fields answer what failed, where, and how the code got there.
| Field or command | What it tells you | What to do with it |
|---|---|---|
BugCheck 9F, {...} line |
The bug check code in hex and its four parameters | Look up the code in the Bug check code reference on Microsoft Learn |
BUGCHECK_STR |
In an app dump, the exception code, such as c0000094 for integer divide-by-zero |
Search the code with the process name |
MODULE_NAME and IMAGE_NAME |
The module and file the analysis blames | Update, roll back or remove that driver or app |
Probably caused by |
A one-line summary of the likely culprit in kernel dumps | Treat it as a lead, then confirm with the stack |
STACK_TEXT |
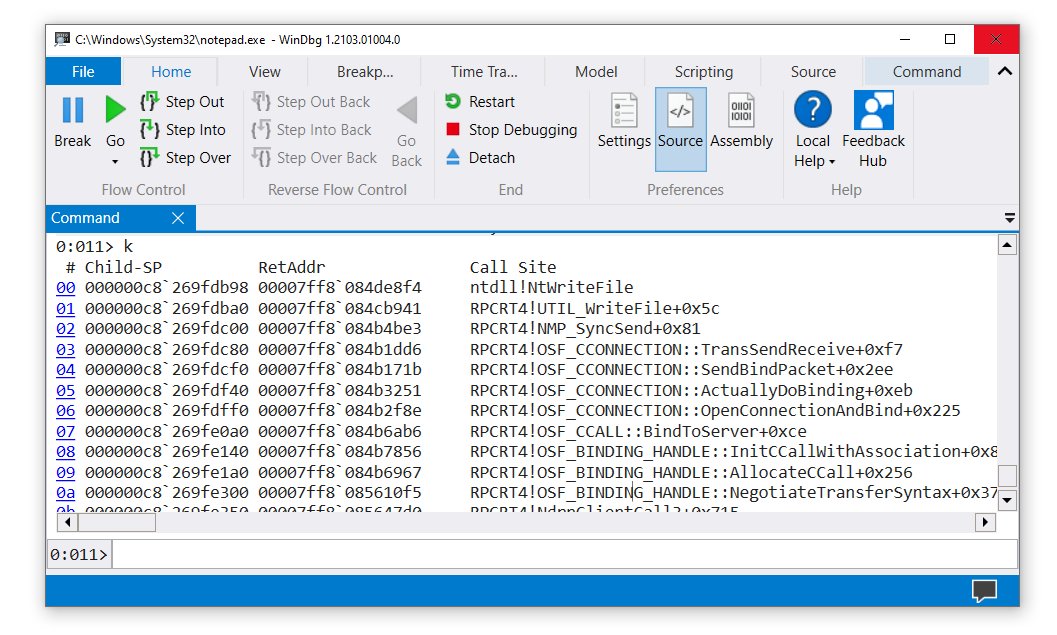
The call stack of the faulting thread, newest call on top | Read from the top to find the first non-Windows module |
FAULTING_IP and FOLLOWUP_IP |
The instruction that was running and the one analysis flags for follow-up | With private symbols, this shows the source file and line |
PROCESS_NAME |
The process that raised the exception | Confirms you opened the right dump |
lm |
Loaded modules with start and end addresses and symbol status | (pdb symbols) means symbols loaded; (deferred) means not needed yet |
Step 7: Analyze a Blue Screen Minidump
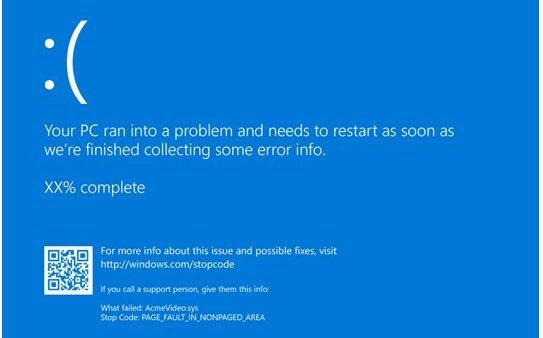
Microsoft estimates that about three quarters of stop code errors come from faulting drivers, so the driver name is usually the payoff.
- Start WinDbg as administrator and press Ctrl + D.
- Browse to
%SystemRoot%\Minidumpand open the newest file. Names encode the date, for exampleMini022900-01.dmp. - Type
.symfix C:\Symbolsand then.reload. - Type
!analyze -vand note the bug check symbolic name, such asDRIVER_POWER_STATE_FAILURE, and its code. - Note
IMAGE_NAMEand theProbably caused byline. - Type
lmto list loaded drivers and check the version of the driver it names. - Update or roll back that driver, then watch whether the same stop code returns.
A small dump only covers the thread that crashed. If repeated minidumps blame different drivers, switch to a kernel memory dump in Step 3. For a larger dump, !process 0 0, !vm and !memusage are also useful.
Step 8: Analyze an Application Crash Dump
App dumps come from Windows Error Reporting, ProcDump or Task Manager. You also need symbols for the app itself; ask the vendor if it is commercial software.
- Press Ctrl + D and open the app's
.dmpfile, for example from%LOCALAPPDATA%\CrashDumps. - Type
.symfix C:\Symbols, then.sympath+followed by the folder holding the app's.pdbfiles if you have them. - Type
.reload, then!analyze -v. - Read
EXCEPTION_RECORDfor the exception code andPROCESS_NAMEfor the app. - Run the command shown under
STACK_COMMAND, such as.ecxr ; kb, to redisplay the faulting stack. - Type
~to list threads and~0sthenkto view the stack of thread 0. - If the app froze instead of crashing, run
!analyze -v -hang.
A minidump preserves less memory, so commands that read memory outside it do not work. Capture a full dump when you need heap or variable contents.
Step 9: Attach WinDBG to a Running Process
Attaching pauses the process, so pick one you can afford to freeze. Notepad is a safe first target.
- Open Notepad, then open WinDbg.
- Select File > Start debugging > Attach to process, or press F6.
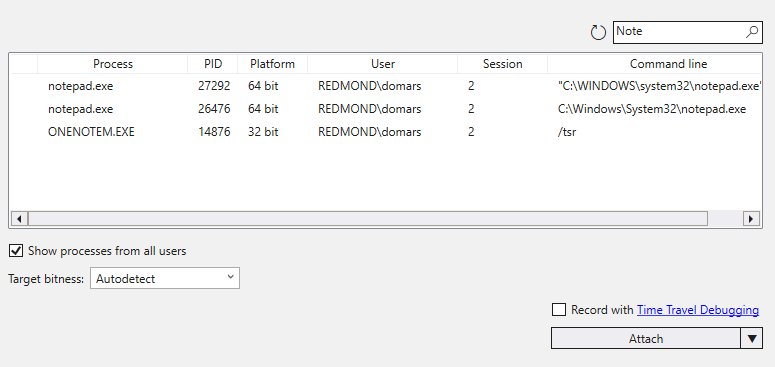
- Select Show process from all users if the process is missing, and type its name in the search box.
- Select the process and select Attach. A User Account Control shield means WinDbg must run as administrator.
- Type
.sympath srv*and then.reload. - Type
kto see the stack,lmto list modules, theng(or F5) to let the process run again. - Type
qdto quit and detach, leaving the process running.
To start a program under the debugger instead, use Launch executable on the same Start debugging page, or press Ctrl + E.
Step 10: Create a Dump from Task Manager
Task Manager writes a dump of a running app without waiting for a crash, which makes it useful for a hung program.
- Press Ctrl + Shift + Esc to open Task Manager.
- Open the Processes or Details tab.
- Right-click the app and select Create memory dump file.
- When the dialog shows the file location, select Open File Location. User-mode dumps save to
%LOCALAPPDATA%\Temp. - Open that
.dmpfile in WinDbg with Ctrl + D and run!analyze -v -hangfor a frozen app.
Windows 11 builds from 22621.1992 also offer Create live kernel memory dump file on the System process, which captures kernel memory without a blue screen.
Step 11: Use ProcDump for Better Crash Capture
ProcDump is a Sysinternals command-line tool from Microsoft. It waits for a crash, a hang or a CPU spike and writes the dump at that exact moment, which Task Manager cannot do.
Get it from the ProcDump page on Microsoft Learn, then run it from an administrator Command Prompt in its folder.
procdump -ma -e -x C:\Dumps notepadLaunches notepad and monitors it. -e writes a dump when the process hits an unhandled exception, -ma makes it a full dump, and -x C:\Dumps sets the output folder. Other useful forms: procdump -ma -e w3wp.exe watches a running process, procdump -h hang.exe dumps when a window stops responding for 5 seconds, and procdump -n 3 -s 5 -c 20 consume writes up to three dumps when CPU stays above 20% for five seconds.
You should see: A .dmp file appears in C:\Dumps after the exception. Open it in WinDbg and run !analyze -v.
Essential WinDBG Commands for Beginners
Type these in the command box at the bottom of the WinDbg window. Commands starting with a dot are debugger settings; commands starting with ! are extensions.
| Command | What it does | Typical use |
|---|---|---|
.symfix C:\Symbols |
Sets the Microsoft public symbol server with a local cache | First command in any new setup |
.sympath / .sympath+ path |
Shows the symbol path, or adds a folder to it | Checking or extending symbols |
.reload / .reload /f |
Reloads symbols; /f forces an immediate load |
After changing the symbol path |
!analyze -v |
Automatic crash analysis, verbose | First look at any dump |
.bugcheck |
Shows only the bug check code and parameters | Quick stop code check |
lm / lml |
Lists loaded modules and their symbol status | Finding a driver version or missing symbols |
k / kb |
Displays the call stack of the current thread | Seeing how the code reached the fault |
~ / ~0s |
Lists threads / switches to thread 0 | App dumps with many threads |
x module!* |
Lists symbols matching a pattern | Finding a function name |
bu / bl |
Sets a breakpoint / lists breakpoints | Live process debugging |
g |
Continues execution (F5) | After a breakpoint or attach |
!sym noisy |
Prints every step of the symbol search | Symbols that will not load |
.dump /ma C:\Dumps\app.dmp |
Writes a dump with all optional data | Saving a live session or shrinking a large dump with /m |
qd |
Quits and detaches, leaving the process running | Ending a live session safely |
How to check WinDbg and symbols are working
- Type
.sympathand confirm the expanded path includesSRV*https://msdl.microsoft.com/download/symbols. - Type
lmand check thatntorntdllshows(pdb symbols)followed by a path in your cache folder. - Open your cache folder, such as
C:\Symbols, and confirm new subfolders likentdll.pdbappeared. - Run
!analyze -vand confirmSTACK_TEXTshows names likeKERNEL32!BaseThreadInitThunkorntdll!RtlUserThreadStartrather than bare addresses.
Common Problems and How to Fix Them
Symbols are not loading
The symbol path is empty or wrong, the network blocks the symbol server, or the files do not match the binary's timestamp.
- Type
.sympathand fix the path with.symfix C:\Symbolsif it is empty. - Type
!sym noisy, then.reload /fto see each location WinDbg searches and why it fails. - Type
lmlto list only modules with loaded symbols. - If noisy output shows network errors, confirm your network allows TLS 1.2 connections to
msdl.microsoft.comand that your firewall permits it. - For your own app, add its build folder with
.sympath+and run.reloadagain.
Access is denied opening a dump
WinDbg lacks permission to read the file, or another process still has it open.
- Close WinDbg, right-click it in the Start menu and select Run as administrator.
- Make sure no other program, such as a copy or upload in progress, is using the dump.
- Open the file again with Ctrl + D.
- If WinDbg reports Could not open dump file instead, run
dumpchkfollowed by the dump path to check whether the file is corrupt, and capture a new dump if it is.
The dump is too large
A complete or full dump includes all memory, and it also needs a paging file big enough for all RAM plus 257 MB.
- For blue screens, switch Write debugging information to Small memory dump or Automatic memory dump in Step 3.
- To shrink an existing file, open it in WinDbg and run
.dump /m C:\Dumps\small.dmp. - For app captures, use ProcDump
-mp(MiniPlus), which Microsoft says is 10% to 75% the size of a full dump. - Move the Dump file location to a drive with more free space.
Missing page errors on an automatic memory dump
Some pages were not captured in the dump.
- Type
.ignore_missing_pagesbefore running further commands. - Run
!analyze -vagain.
Best Practices for Beginners
| Practice | Why it matters |
|---|---|
| Always set a local symbol cache | Symbols download once, and later sessions load faster with less network traffic |
| Keep manual symbols and the server cache in separate folders | Microsoft advises against mixing them |
| Treat full and complete dumps as private data | They can hold data from every process that was running, including open documents |
| Start with a small or automatic dump | Small dumps are quick to write and share; switch to kernel dumps only when needed |
| Run WinDbg as administrator only when required | Elevation is needed for protected files and processes, not for your own dumps |
Use qd rather than closing WinDbg on a live process |
It detaches and leaves the app running |
Read !analyze -v as a lead, not a verdict |
Confirm the blamed module with the call stack and a second dump before removing software |
Frequently Asked Questions
Can you run WinDbg on Windows 10?
Yes. The current WinDbg supports Windows 10 version 1607 (Anniversary Update) and newer on x64 and ARM64 processors. Older Windows 10 builds and 32-bit PCs need WinDbg (classic), which comes with Debugging Tools for Windows in the Windows SDK.
How do I install WinDbg?
Run winget install Microsoft.WinDbg in PowerShell, install WinDbg from Microsoft Store, or use the Download WinDbg link on Microsoft Learn's Install WinDbg page. All three give the same debugger, and Store and direct installs update themselves automatically.
How do I install WinDbg on Windows 11?
Use the same steps as Windows 10: run winget install Microsoft.WinDbg, or install WinDbg from Microsoft Store. Microsoft lists all versions of Windows 11 as supported, and Windows 11 Task Manager can also create kernel and process memory dumps for WinDbg to open.
How do I open WinDbg?
Search for WinDbg in the Start menu and select it, or run WinDbgX in Command Prompt or PowerShell. After installation, WinDbgX.exe runs from any directory, so you do not need to know the install folder.
How do I start WinDbg with a dump file already loaded?
Run WinDbgX -z followed by the dump path, adding -y and a symbol path if you want symbols set at launch. Put quotation marks around any path that contains spaces, then run !analyze -v once the prompt appears.
How do I set up WinDbg?
Install it, then set a symbol path with .symfix C:\Symbols and .reload. Save the path under File > Settings so it persists, and configure Windows under Startup and Recovery to write crash dumps for WinDbg to read.
How do I use WinDbg for the first time?
Press Ctrl + D to open a .dmp file, set symbols with .symfix and .reload, and run !analyze -v. Read the bug check or exception code, IMAGE_NAME and STACK_TEXT to find the module that failed.
How do I run WinDbg as administrator?
Right-click WinDbg in the Start menu and select Run as administrator. You need elevation to open dumps in protected folders such as %SystemRoot%\Minidump and to attach to processes marked with a User Account Control shield.
Where is WinDbg installed on Windows 11?
You rarely need the folder: after installation, WinDbgX.exe runs from any directory, and the Start menu entry opens it too. Its settings live in %LOCALAPPDATA%\DBG, with workspaces in the Workspaces subfolder and saved sessions in Targets.
Is WinDbg Preview the same as WinDbg?
Yes. The app Microsoft released as WinDbg Preview in Microsoft Store is now simply called WinDbg. It uses the same engine as WinDbg (classic) and supports the same commands, extensions and workflows.